How many counters, lanes, gates and stands does your terminal need at the peak hour? Proven in a simulation before the drawings freeze.
Whole-airport models, landside kerb to apron stand, delivered for airport operators in India and through terminal design consultants in the Gulf and the USA, judged against IATA ADRM level of service.
Trusted by the World’s Most Demanding Plants.































































What does an airport simulation consultant build?
An airport simulation consultant builds a computer model of the terminal, the apron and the kerb that moves every passenger, bag and aircraft of the busy day through the airport minute by minute, and reports the queue, the wait, the space per passenger and the stand demand at every point against the IATA Airport Development Reference Manual level-of-service targets. It is a discrete event simulation (a model that advances one event at a time: a passenger joins a queue, a bag enters screening, an aircraft takes a stand), built in FlexSim from your flight schedule and your measured processing times, and it answers the capacity question with a figure instead of a rule of thumb.
The question arrives in three forms: a terminal is being expanded or a new terminal designed and the counter, lane, gate and stand counts have to be proven before the drawings freeze; an operator or an investor is acquiring an airport and wants to know what the existing terminal can really take; or a running terminal is breaching its wait-time targets and nobody agrees whether the fix is more counters, a different queue layout or a schedule change. The model answers all three with the same numbers: passengers per hour at each process, maximum queue and wait in the peak, space per passenger against the IATA band, stand occupancy on the busy day, and the output of every option on the table.
Airport capacity terms, in plain words
| Term | What it means | What the model does with it |
|---|---|---|
| Busy-day schedule | The flight schedule of the design day: the day the terminal is sized for, usually the 30th or 40th busiest day of the year | Drives every arrival of passengers, bags and aircraft in the model; the whole study hangs on it |
| Peak hour (design hour) | The busiest 60 minutes of the busy day for the process being sized, which is a different hour for check-in, security and the apron | The model finds it from the schedule and the show-up profile; it is never assumed |
| Show-up profile | How early passengers arrive before departure, by flight type and route | Turns the schedule into a demand curve at check-in and security; measured at your airport, not copied from a textbook |
| Level of service (IATA LoS) | The ADRM bands for space per passenger and maximum waiting time at each process: over-design, optimum, sub-optimum, under-provided | Every scenario is scored against the optimum band; a counter count that passes throughput but fails space is reported as a fail |
| Processing time | Seconds per passenger at a counter, a lane, a desk or an e-gate, with its spread | Measured on your floor with a stopwatch and a count; the single input that most changes the answer |
| Stand occupancy | Which stand each aircraft holds, from on-blocks to off-blocks, with the buffer between movements | Built from the schedule and the turnaround rules; shows the stand that clashes before the slot is sold |
| Scenario | One set of changes (counters, lanes, e-gates, a queue layout, a stand plan, a schedule), run as the full busy day | Each option in the report is one scenario with its queue, wait, LoS and cost |
| Validation | Running the model on a day the airport already lived through and comparing it with what the cameras and the queue counters recorded | Done before any option is run; the fit is in the report |
Want the real capacity of your terminal, not the formula? The one-page peak-hour check comes back from the busy-day schedule and last month's queue readings.
How many check-in counters and security lanes does a terminal need at the peak hour?
As many as the busy-day schedule, the show-up profile and the measured processing time say, judged against the IATA ADRM optimum band for wait and space; the static formula (peak-hour passengers divided by passengers per counter per hour) gives the starting count, and the simulation then finds how many of those counters the queue actually needs open in each 15 minutes, which is usually fewer at most hours and more in one. The same method sizes security lanes, immigration desks and e-gates, baggage screening lines and gate seating.
| Process | What the static formula gives | What the simulation adds |
|---|---|---|
| Check-in and bag drop | Peak-hour passengers by airline and class, divided by counter throughput | Counters open per 15 minutes, common-use versus dedicated, kiosk and bag-drop split, queue length against the hall depth |
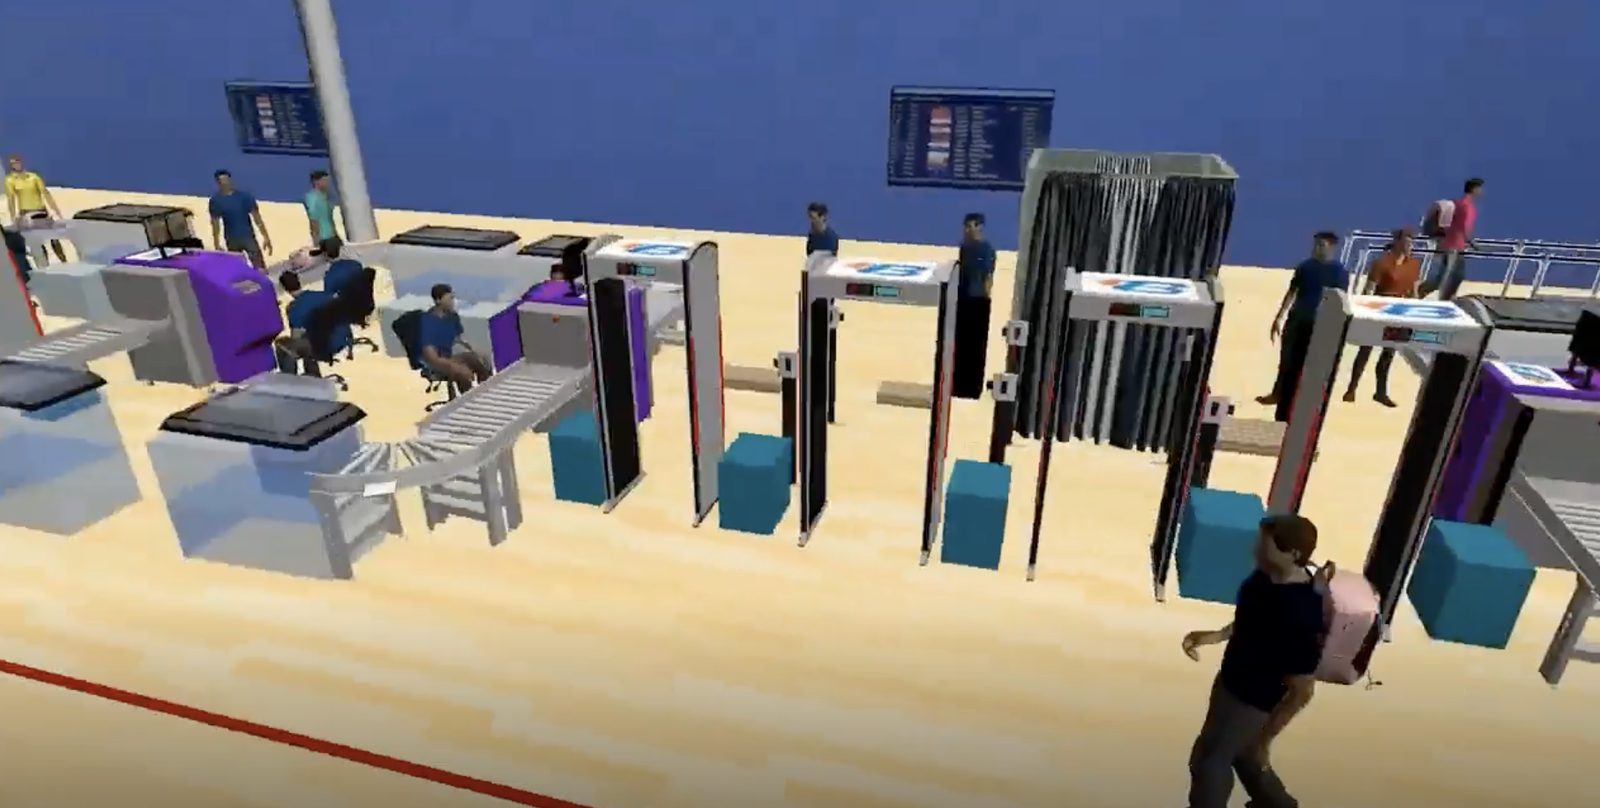
| Security screening | Peak-hour passengers divided by lane throughput | Lane opening plan, divest and reclaim length, WTMD and frisking booth count by gender, express and staff lane rules, the queue that spills into the hall |
| Immigration | Peak arrivals bank divided by desk throughput | Desks against the bank, e-gate take-up by nationality mix, the holding space before the desks, transfer passengers |
| Baggage handling | Bags per hour divided by screening line capacity | Infeed timing from check-in, screening levels and recirculation, make-up allocation, early bag store, the first and last bag at reclaim |
| Gates and apron | Peak aircraft on the ground divided by stands | Stand occupancy for the whole busy day with turnaround and buffer times, towing, contact versus remote, bus gate demand, gate seating against the boarding rule |
| Landside kerb and car park | Peak vehicles divided by bays and dwell | Kerb length and dwell by vehicle type, taxi and bus bays, ramp queue, car park occupancy through the day |
The static formula gets the budget. The simulation gets the terminal built right: it is the only method that shows the wait at 07:15 when three banks overlap, which is the figure the operator, the regulator and the airlines will hold the terminal to.
Get the counter, lane, desk and stand counts for your own peak hour, judged against IATA level of service.
Which parts of an airport does VB simulate?
All six process areas of a passenger terminal and the apron and kerb around it: check-in and bag drop, security screening with frisking, immigration and e-gates, baggage handling, gates and apron stands, and the landside kerb and car park. Each area is modelled as its own queue system and then joined into one whole-terminal model, so a change at security shows up at the gate and a late bank of arrivals shows up at the kerb. The panels below are illustrative runs of each area; the figures for your terminal come from your schedule.
Every panel is the same model type: a discrete event simulation (a model that moves every passenger, bag and aircraft through time, one event after another) built in FlexSim against the busy-day flight schedule, with the processing times measured at your airport, judged against the IATA ADRM level-of-service targets for space and wait.
Pick the process areas that matter to your decision: one, or all six in one model.
What does an airport check-in and security simulation look like when it runs?
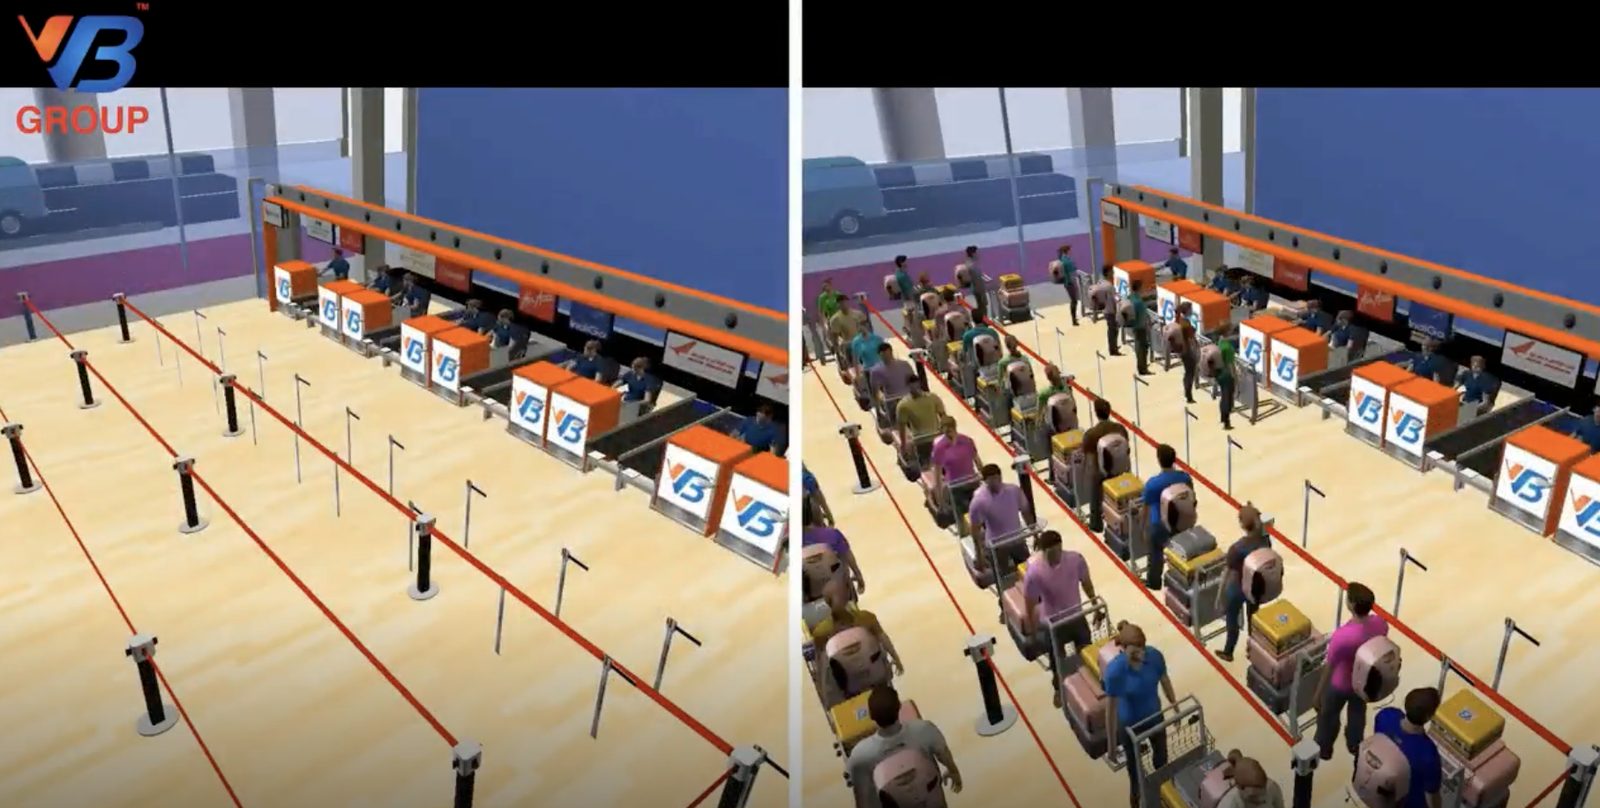
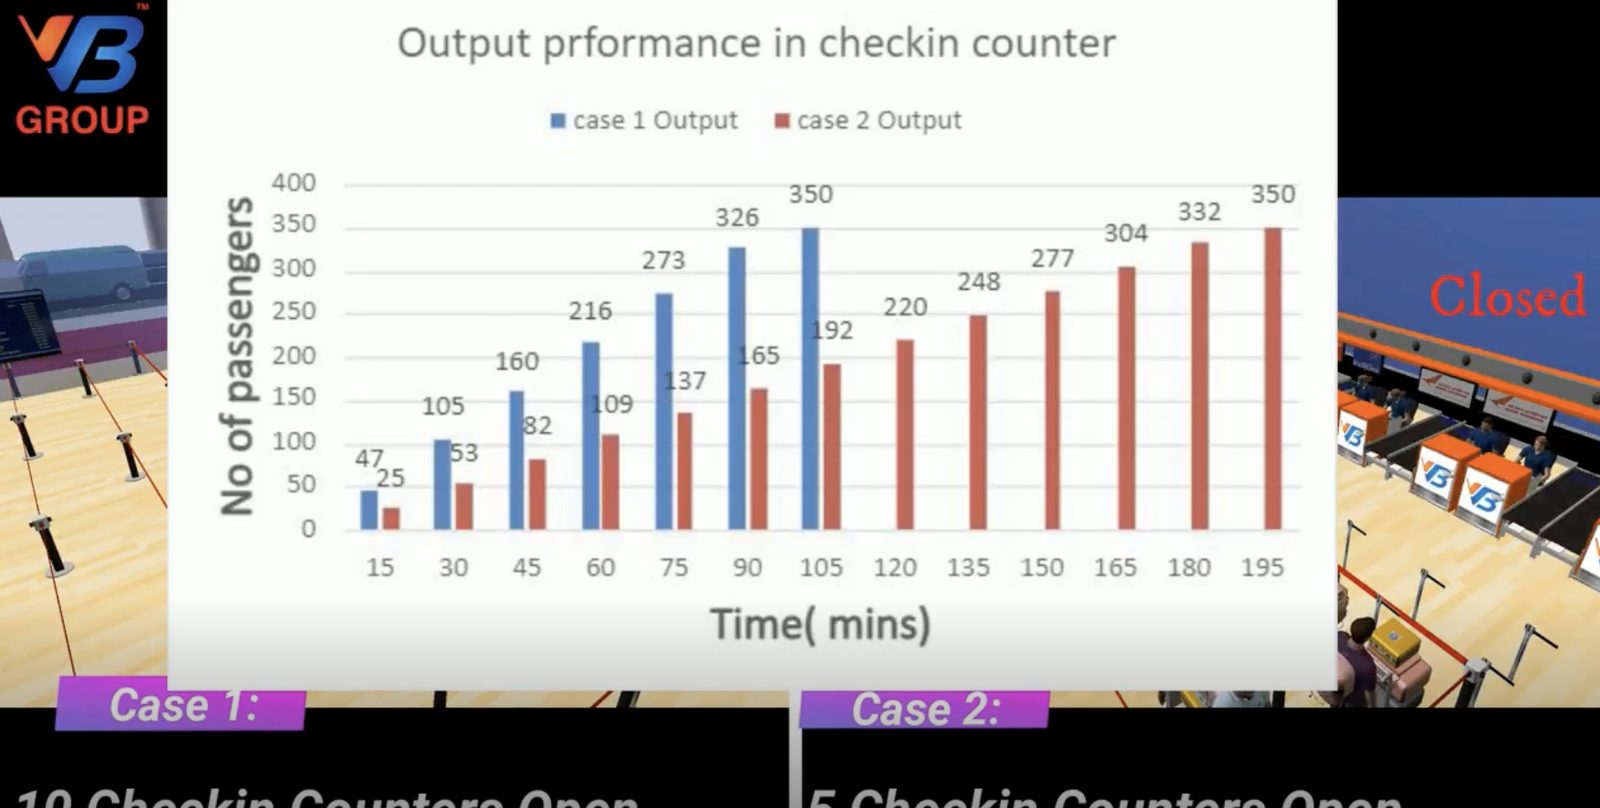
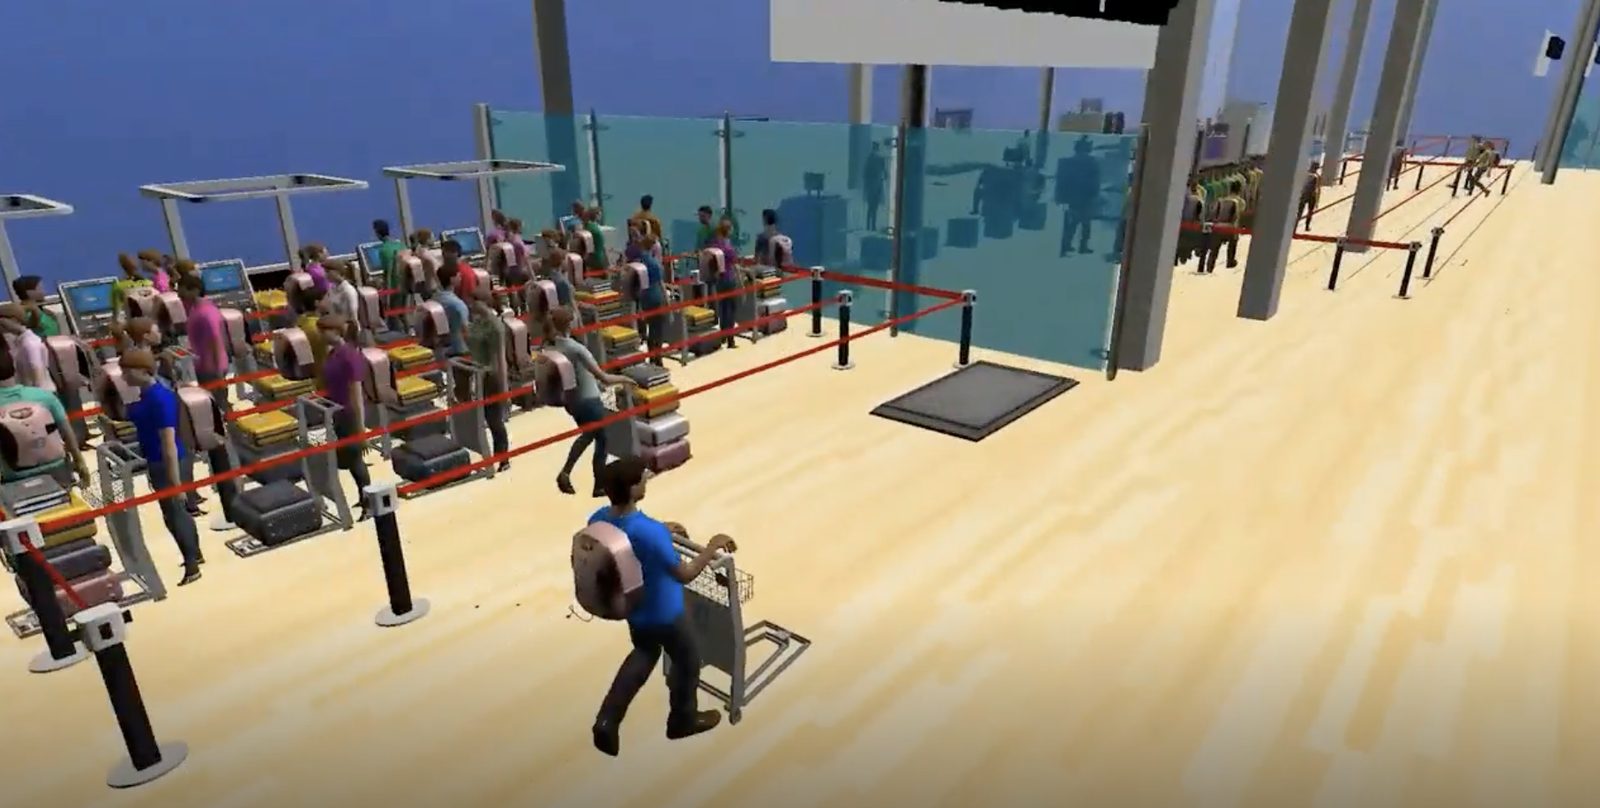
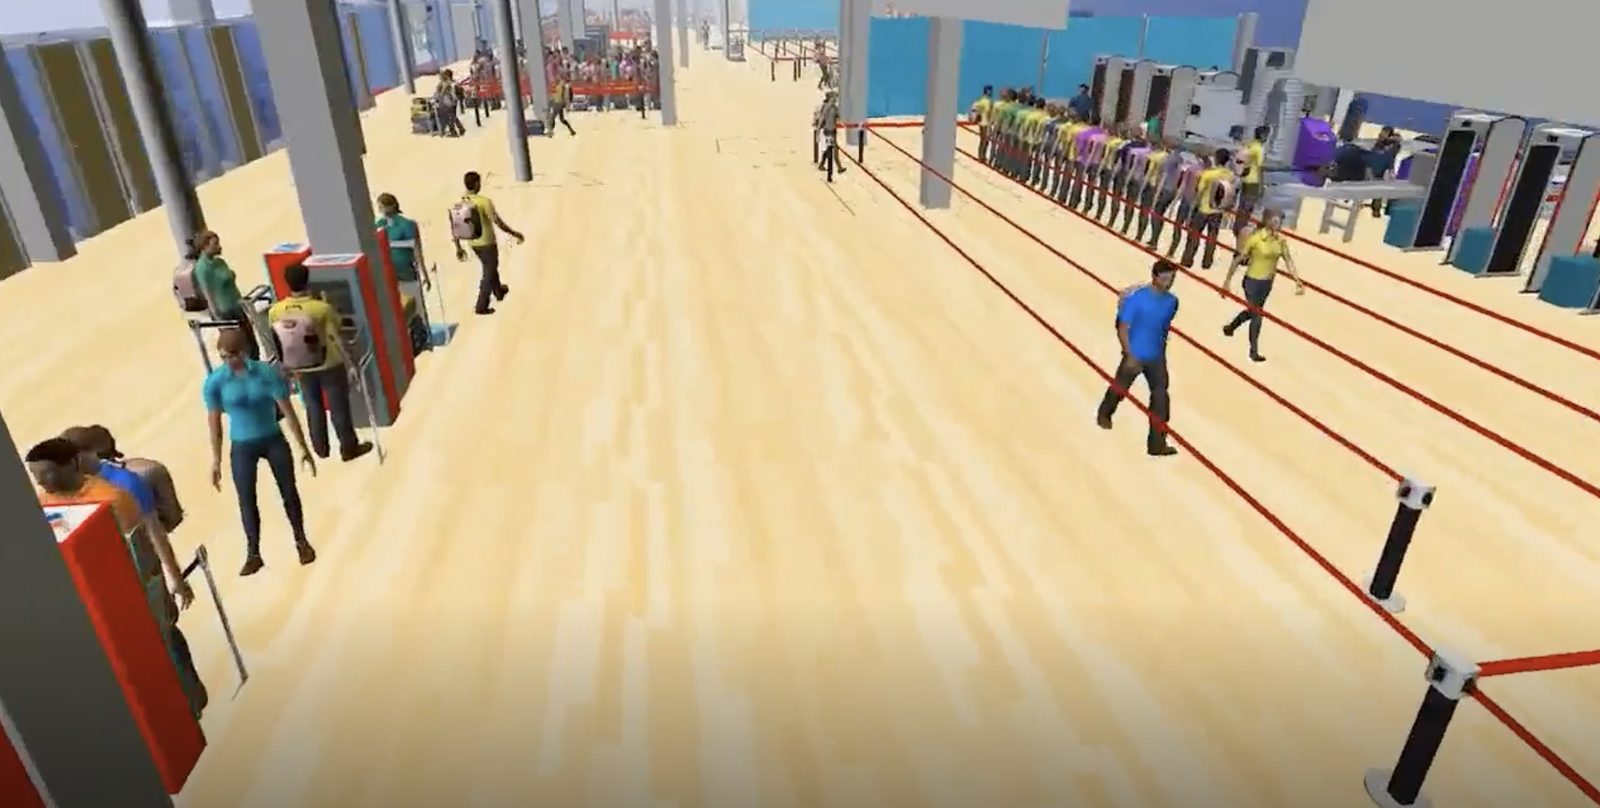
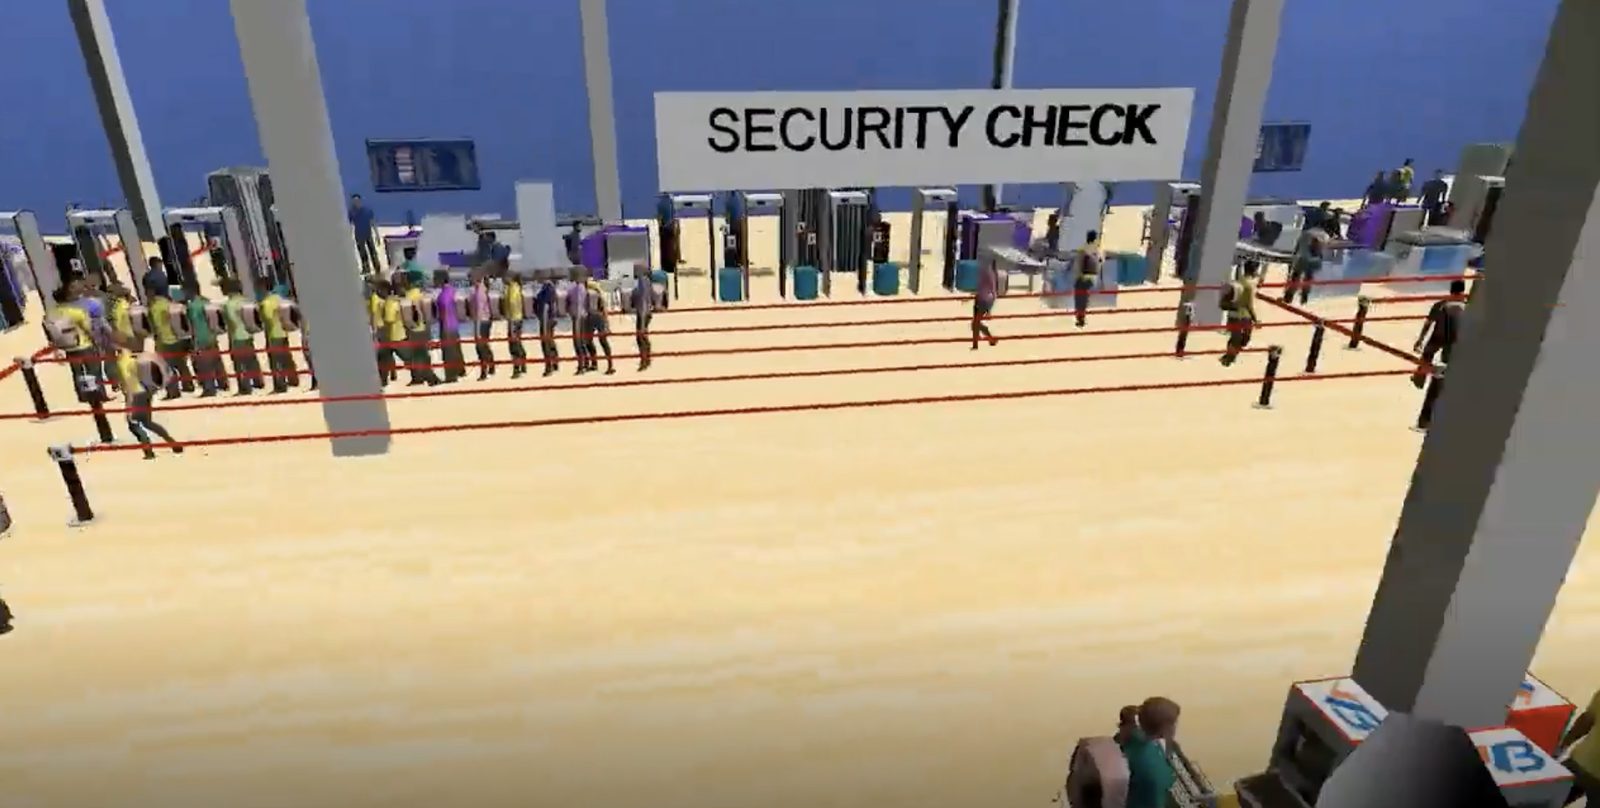
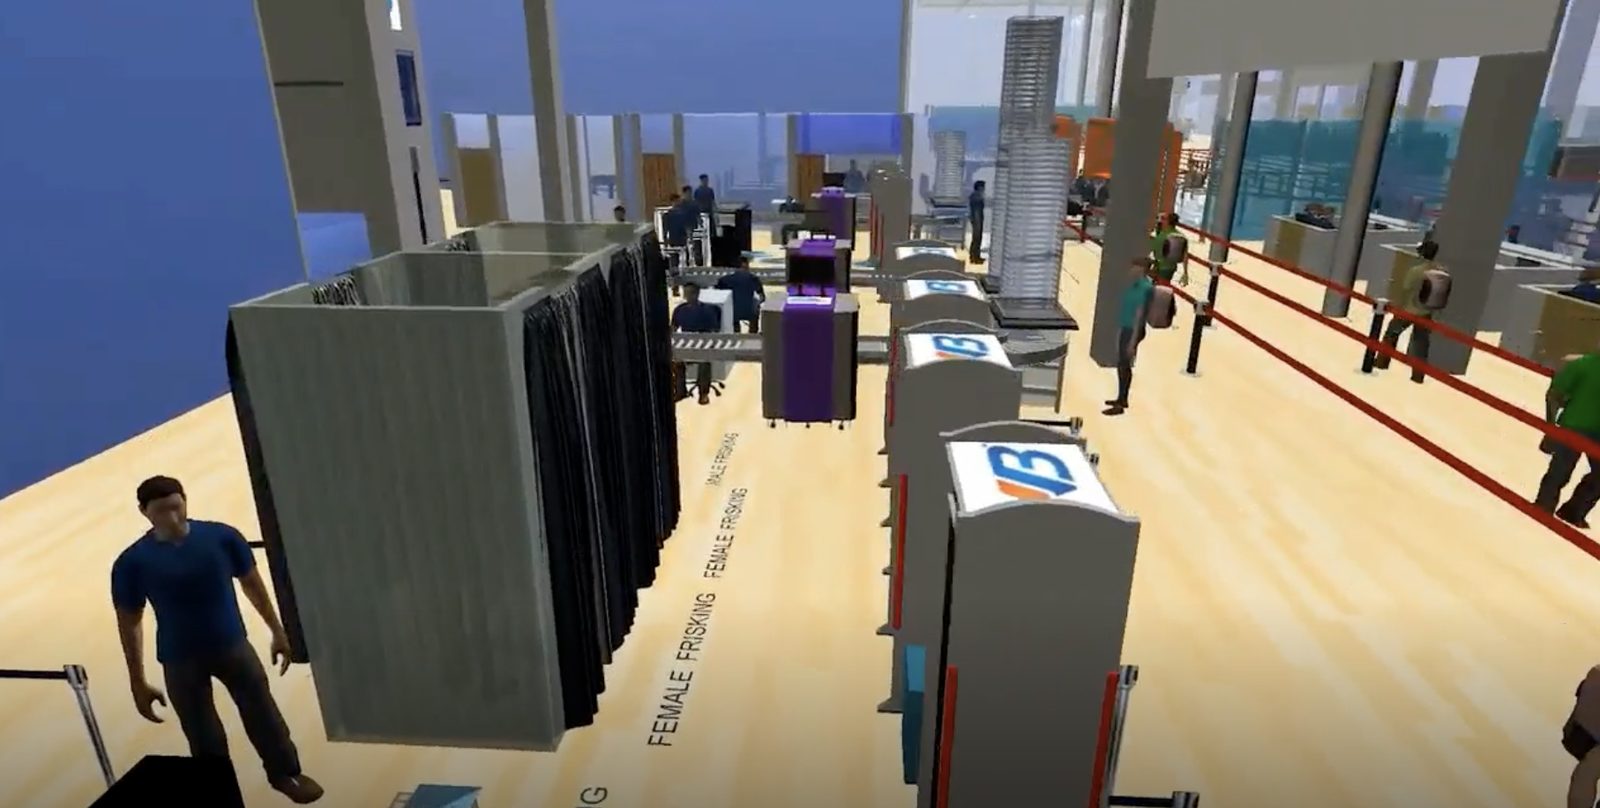
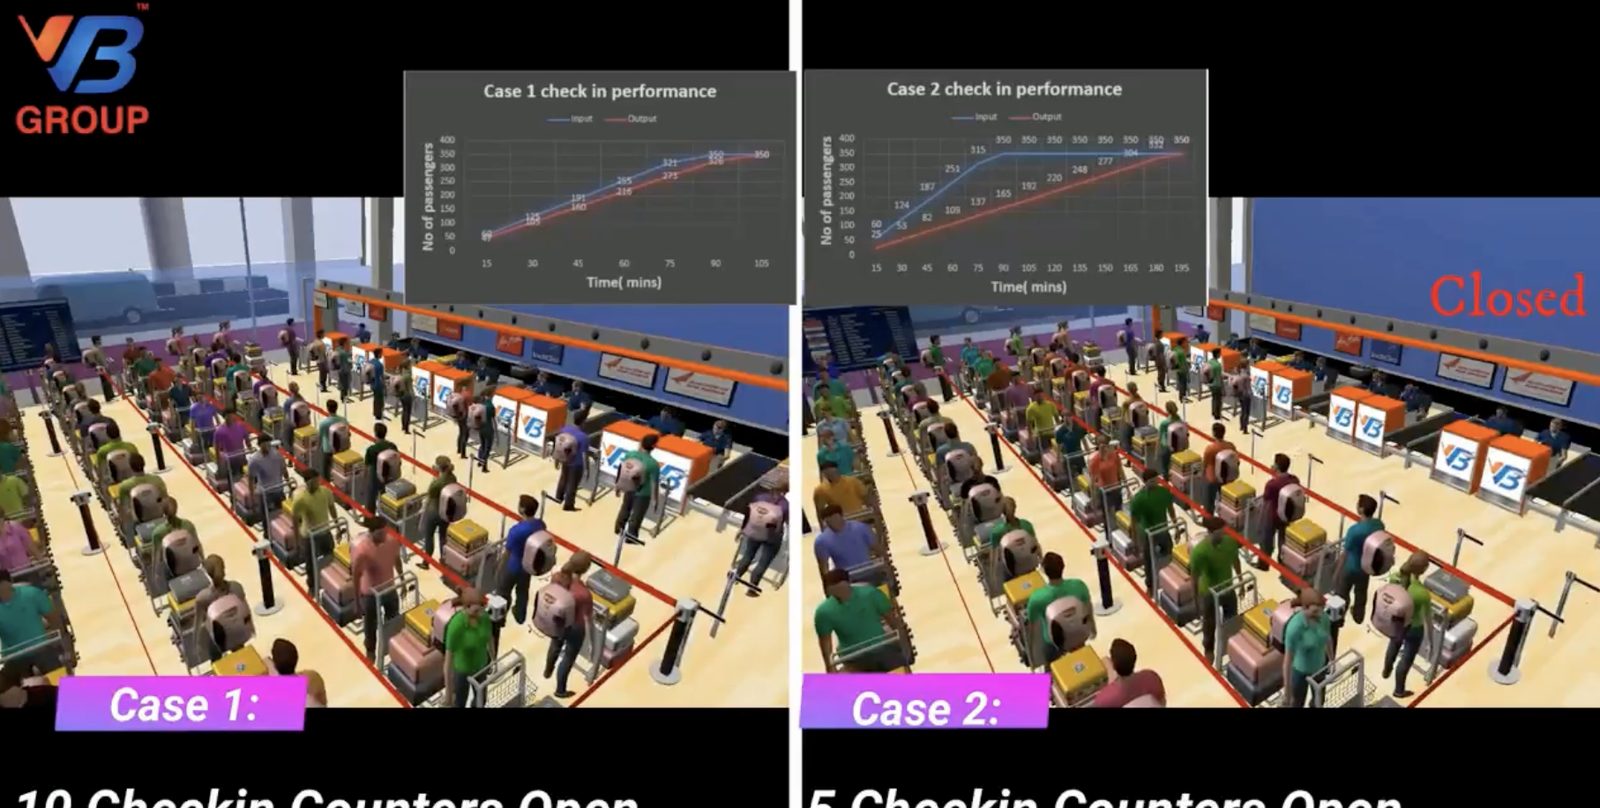
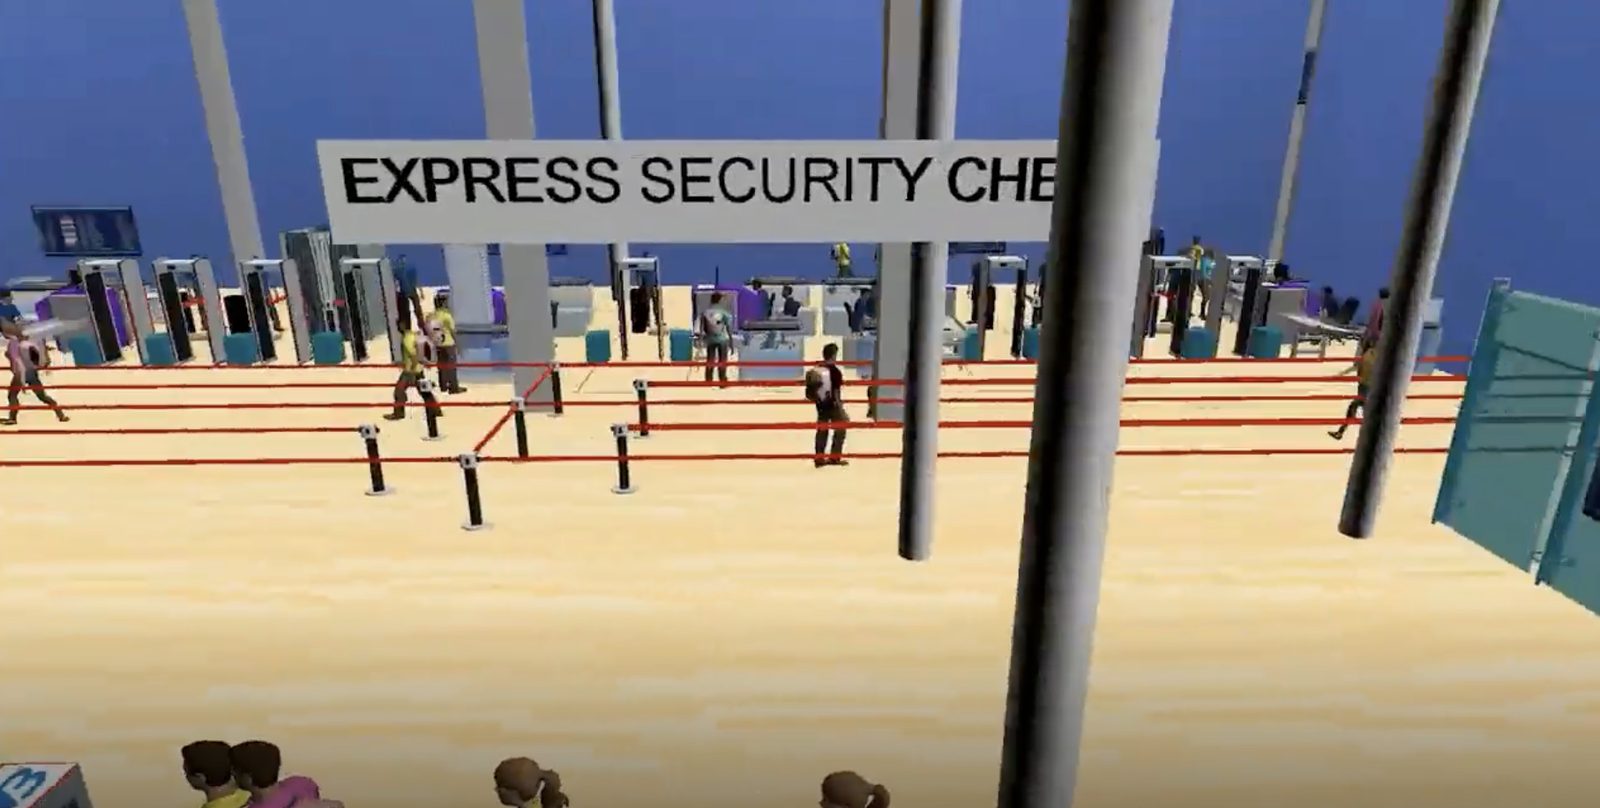
The 1 minute 47 second walkthrough below is VB's own terminal model: the check-in hall at the peak with ten counters open against five, the output chart that compares them, then the security hall lane by lane with the X-ray, the walk-through detector and the frisking booths as separate steps, the queue clearance at each, and the express security lane tested against the standard lanes. It is the same model type delivered for the operator in the case on this page, shown as a representative run.
Digital twins for airports and emulation, VB Group, on YouTube. The player loads only when you press play; no cookies are set before that.
Want this run on your own terminal, with your schedule and your counters? The one-page peak-hour check comes first.
When does an airport need a simulation study?
The order comes when a count has to be defended: a terminal expansion or a new terminal is at concept or schematic design and the counter, lane, gate and stand numbers have to hold before the drawings freeze; an acquirer wants to know what the terminal can really take; or a running terminal is breaching its wait-time targets and the operator, the airlines and the security agency each have a different fix.
Expansion, new terminal, acquisition or a queue breach: price the study for your situation.
How does an airport simulation compare the options for a terminal?
Every option is run as the full busy day against the same schedule and show-up profile, and reported on the same five numbers: maximum wait in the peak, queue length against the space available, IATA level of service, the count of counters, lanes, gates or stands it needs, and what it costs. The table below is one departures hall with a check-in and security problem, modelled as an illustration; the figures for your terminal come from your schedule.
| Scenario | Peak wait, check-in | Peak wait, security | IATA LoS | What it costs |
|---|---|---|---|---|
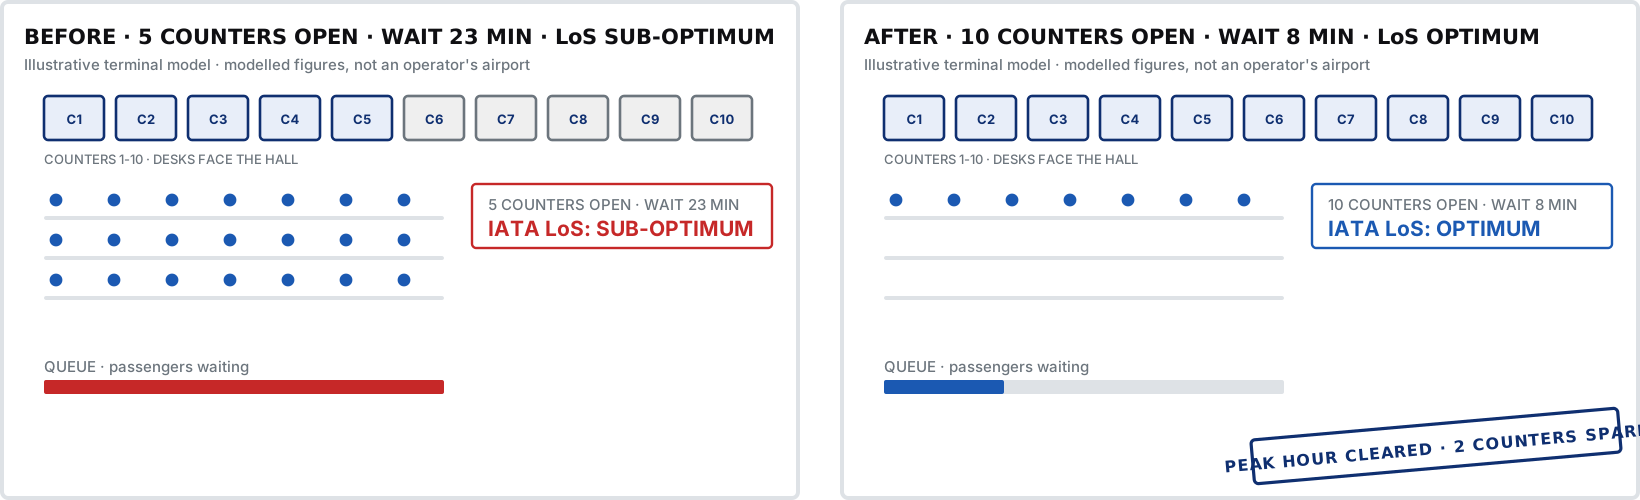
| Today · 5 counters and 3 lanes open at the peak | 23 min | 14 min | Sub-optimum | Nothing; the airlines and the regulator keep the wait-time breach on record |
| Option A · counter opening plan and an express security lane rule | 12 min | 8 min | Optimum at check-in; sub-optimum at security 07:00 to 07:30 | Rostering and a lane rule; no capex |
| Option B · Option A plus 5 common-use counters and a fourth lane in the existing hall | 8 min | 6 min | Optimum, whole day | Counters, one lane, queue rails; inside the current footprint |
| Option C · new departures hall | 5 min | 4 min | Over-design until the next phase of traffic | A hall and the landside road changes; needed only when the forecast passes Option B |
The board sees that the forecast needs Option B and not the new hall; the projects head sees that five counters, one lane and a queue layout close the gap inside the current footprint. That page is what the model is for, and it is the page a lender, a regulator or an acquirer reads first.
Get the option table for your own terminal: wait, queue, level of service, counts and cost per option.
Which standards govern an airport capacity study?
No statute requires an airport simulation, and every standard that governs the terminal, the airside and the security process shapes what the model is allowed to propose: the IATA ADRM sets the level-of-service bands the scenarios are scored against, ICAO Annex 14 and the national authority govern the apron and stands, and the security regulator sets the screening process the lanes have to follow.
| Standard | What it does to the options |
|---|---|
| IATA Airport Development Reference Manual (ADRM, 12th edition) | Level-of-service bands for space per passenger and maximum waiting time at check-in, security, immigration, gate hold rooms and reclaim. Every scenario is scored against the optimum band; the report says which band each option lands in and for how many minutes of the day. |
| ICAO Annex 14 and the national civil aviation authority | Aerodrome design, stand clearances, taxilane separations and apron safety. A stand plan that holds the schedule only counts if every stand it uses is a compliant stand for that aircraft code. |
| Security regulator rules (BCAS in India, TSA in the USA, GCAA and GACA in the Gulf) | The screening process, the divest and reclaim steps, frisking by gender and the staff and express lane rules. The model never uses a lane process shorter than the regulator allows. |
| Your operator, lender and concession standards | The concession agreement's service levels, the lender's capacity covenants and the operator group's own design standards. They are inputs to the model, not footnotes, and the report is written to be read against them. |
The IATA level-of-service bands and the busy-day definition are stated on the first page of every VB airport report, so a regulator or a lender can see what the terminal was sized to.
What does an airport simulation study include?
The study starts with the terminal as it runs today or as it is drawn, modelled and validated against a day the airport already recorded, and ends with the option table and the report the board, the designer, the lender and the regulator each take their page from.
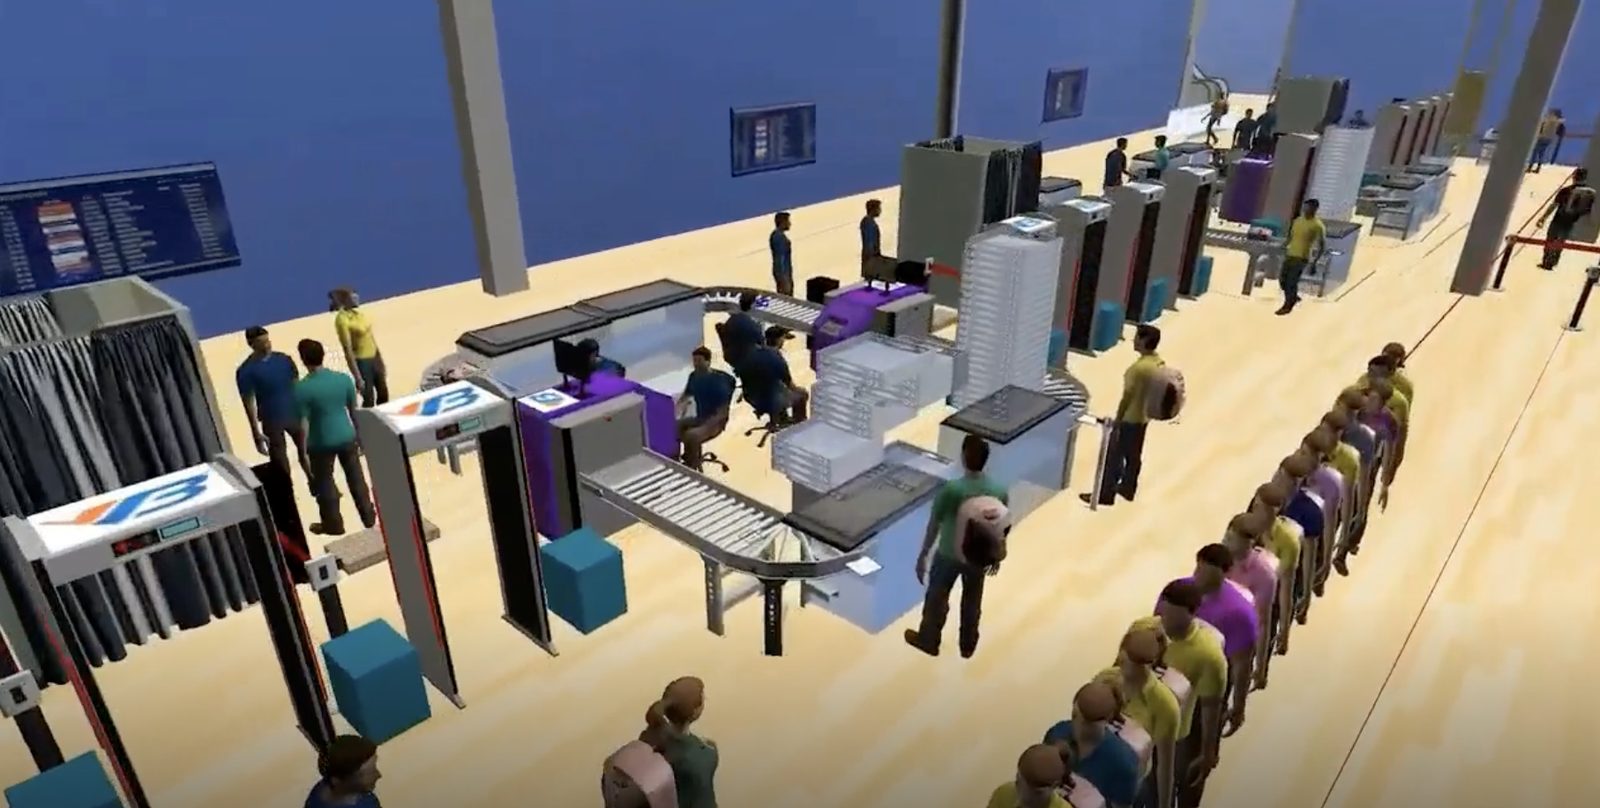
- Data pack: busy-day flight schedule, show-up profiles by route and carrier, processing times measured on your floor, bag-per-passenger ratios, nationality mix for immigration, turnaround and towing rules, vehicle mix at the kerb
- Whole-terminal model in FlexSim: check-in and bag drop, security and frisking, immigration and e-gates, baggage handling, gates and apron stands, landside kerb and car park, or any one of them alone
- Validation run against a recorded day, with the fit reported before any option is run
- Three to five scenarios, each run as the full busy day: wait, queue, space, IATA level of service, counts, cost
- Option table and recommendation, with the counter, lane, gate and stand schedule and the queue layout drawing that goes with it
- Capacity report for the design freeze, the board paper, the acquisition data room or the regulator, plus the model file and a walkthrough with your team
Send the busy-day schedule and last month's queue readings: the one-page peak-hour check comes back with the counters and lanes the formula says, the counters and lanes the queue needs, and the gap.
How is an airport simulation study priced?
Three things set the price: how many process areas are modelled, whether the schedule and processing times exist in your records or have to be measured on the floor, and how many scenarios the decision needs. One process area on your own data is the smallest study; a whole airport with apron, stands and kerb, or a takeover review with a data-room deadline, is the largest.
| Part of the work | How it is priced | What moves the price |
|---|---|---|
| One process area (check-in, security, immigration, baggage, apron or kerb) | Peak-hour passengers and the counts in play | Scenarios, whether the data is measured or supplied, report for a design freeze or a board paper |
| Whole terminal, kerb to gate | Terminal size plus field days | Process areas to measure, banks to observe, airlines and the security agency to interview |
| Whole airport or acquisition due diligence | Terminals, apron, stands and landside in one model | Phases and forecast years, schedule cases, data-room deadline |
Get a price estimate
Three questions about your airport. A simulation engineer compares them with airport studies already delivered and sends the estimate.
Nothing is quoted by a calculator. A simulation engineer reads your answers; if you want proof first, the one-page peak-hour check of your busiest process comes before the estimate.
How does VB build an airport simulation model?
Four steps, each with something you can hold: the data pack is assembled from your schedule and the gaps measured on the floor, the model is built and validated against a recorded day, the options are run as the full busy day each, and the report is walked through with operations, the designer and the security agency before it goes to the board or the data room.
Data pack
Busy-day schedule, show-up profiles, bag ratios, nationality mix and turnaround rules collected; processing times at every counter, lane, desk and e-gate measured on the floor across the peak banks.Model and validate
Terminal, apron and kerb built in FlexSim; a recorded day run and the queues compared with what the cameras and counters logged. The fit is reported before any option is run.Scenarios
Three to five options run as the full busy day: opening plans, lane rules, counters, e-gates, queue layouts, stand plans, schedule cases. Wait, queue, space, IATA level of service, counts and cost on one table.Report and walkthrough
Capacity report for the design freeze, the board, the lender or the data room; the model file; and a walkthrough with operations, the designer and the security agency so every figure has an owner before it is signed.A terminal sized by the static formula is sized for an average hour that never happens. The breach comes at the 15 minutes when three banks overlap, a lane is down and the show-up profile is earlier than the textbook. VB builds those into the model from your schedule and your measured processing times, validates the model against a day the airport already lived through, and only then sizes the counters, lanes, gates and stands.
Seven weeks from data pack to walkthrough. Book the measurement weeks now.
Which software does VB use for airport simulation?
VB builds terminal, apron and landside models in FlexSim, the discrete event simulation platform now part of Autodesk, and hands the model file over with the report so your planners can re-run scenarios after the study. Queue layouts and stand plans are drawn in AutoCAD on the terminal base plan, and the level-of-service scoring follows the IATA ADRM. VB's simulation teams also work in AnyLogic and Simio where a design consultant or an operator standard specifies them.
| Stage | Tools we work in | What you receive |
|---|---|---|
| Data pack | Your busy-day schedule, queue logs and camera counts · stopwatch and count on the floor at every process across the peak banks | One data pack with every input and its source, signed off by operations and the security agency |
| Model and validate | FlexSim terminal, apron and kerb model · validation run against a recorded day | The model, its validation fit and the assumptions register |
| Scenarios | FlexSim experimenter, three to five options, each run as the full busy day | Option table: wait, queue, space, IATA LoS, counts, cost |
| Layout where needed | AutoCAD on the terminal base plan | Queue layout, counter and lane arrangement or stand plan in DWG and PDF |
| Report and handover | Capacity report, FlexSim model file, scenario dashboards, 3D walkthrough video, walkthrough session | A design-freeze paper, a board or data-room annex and a model your planners can keep running |
Running a different platform? Tell us which one in the form. We deliver in the software and drawing standard your plant already uses.
Product names are trademarks of their respective owners.
What does an airport simulation study deliver, start to finish?
A large private airport operator group in India asked for its departures process to be modelled across check-in, security screening and frisking at one of its terminals, with the counter and lane counts for the peak banks tested before the terminal plan was committed. The brief: prove the counts, show the queue, and give operations an opening plan it could roster to.
The model ran the busy-day schedule through the hall with five counters open and then with ten, and reported passengers processed, queue length and wait every minute of the peak; the output chart on this page is from that comparison. Security was modelled lane by lane with the X-ray, walk-through detector and frisking booths as separate steps, and an express lane rule was tested against the standard lanes. The operator received the counter and lane opening plan per 15 minutes, the queue layout that kept the hall inside the IATA optimum band, and the model file. The operator and its airports are not named; the figures on this page are representative.
Proof before commitment: a one-page peak-hour check of your busiest process.
Who builds, checks and signs your airport model?
Three names go on every proposal, with CVs: the simulation engineer who builds and validates the model, the airport planning engineer who checks every input against the schedule and the IATA ADRM, and the approver who signs the report.
Simulation lead
CV shared with the proposalAirport planning engineer
CV shared with the proposalVB Engineering approver
CV shared with the proposalAirport simulation: the questions operators, designers and acquirers ask
How do you test a new check-in layout before building it?
Build the proposed hall in the model, run the busy-day schedule through it with the measured show-up profile and processing times, and read the queue and wait every minute of the peak. Kiosks, bag drop, common-use counters and a new queue snake are each a scenario; the report says which layout holds the IATA optimum band and how many counters it needs open per 15 minutes. No rail is moved until the model has passed.
Can simulation show whether the existing terminal can take the traffic without an expansion?
Yes, and that is the first run after validation. The model runs the forecast schedule through the terminal as it stands and reports the first process to breach the IATA band and the year it happens. Often an opening plan, a lane rule or five more counters inside the current footprint buys several years; the report shows the year the expansion is actually needed and what it must contain.
What does an airport capacity study for an acquisition or takeover cover?
What the terminal, apron and kerb can really take against the real schedule rather than the capacity stated in the information memorandum, the first process to breach and when, the capex that lands after closing and its order, and the level of service the concession or lender covenants require. It is delivered to the data-room deadline with the model file, so the acquirer's own planners can keep running it.
How many check-in counters does a terminal need at the peak hour?
The static formula gives peak-hour passengers divided by counter throughput; the simulation gives the number that holds the queue inside the IATA optimum band every 15 minutes of the busy day, which is the figure that survives the regulator and the airlines. On this page a hall with five counters open at the peak shows a 23-minute wait and ten counters an 8-minute wait, with two spare, as an illustration. Your figure comes from your schedule.
How do you size security lanes for the peak hour?
From the measured lane throughput, which depends on the X-ray, the divest and reclaim length, the walk-through detector and the frisking booths, not from a catalogue figure. The model opens lanes against the show-up curve, tests express and staff lane rules, and reports the wait at the busiest lane every minute. The lane count that holds the IATA band is the answer, and it is usually one lane and a rule, not a new hall.
What inputs does an airport simulation need?
The busy-day flight schedule, show-up profiles by route and carrier, processing times at each counter, lane, desk and e-gate, bags per passenger, the nationality mix for immigration, turnaround and towing rules for the apron, and the vehicle mix at the kerb. Most of it sits with operations and the airlines; VB measures on the floor what the records do not hold.
How long does an airport simulation study take?
About seven weeks for a terminal on your own data: two weeks for the data pack and floor measurement, two for the model and its validation, two for the scenarios and one for the report and walkthrough. One process area is faster; a whole airport with apron and landside, or an acquisition review, is set by the data-room date. The proposal commits to a schedule for your airport.
How much does an airport terminal simulation study cost?
The number of process areas, whether the schedule and processing times exist or have to be measured, and the number of scenarios set the price. One process area on your own data costs least; a whole airport with apron, stands and kerb costs most. The estimator on this page gets you a figure by email with a written proposal; there is no rate card on screen.
What does an airport simulation consultant deliver?
The data pack and its sources, the model and its validation fit against a recorded day, each scenario run as the full busy day with wait, queue, space, IATA level of service, counts and cost, the option table and recommendation, the counter, lane, gate and stand opening plan per 15 minutes, the queue layout drawing, and the FlexSim model file with a walkthrough.
Does VB work directly with airport operators or through design consultants?
Both. In India VB contracts directly with airport operators. In the Gulf, the USA and elsewhere VB works as the simulation subconsultant to the terminal design consultant, master planner or PMC that holds the contract, and delivers to that firm's programme and standards. Either way the model, the report and the walkthrough are the same.
A question not answered here? A simulation engineer replies within one working day.
Where to go next
Get a price estimate for your airport simulation study
Say what is being decided, which process areas are in scope, the peak-hour passengers and when the number is needed. A simulation engineer comes back with the estimate, the schedule and a written proposal.
- A one-page peak-hour check of your busiest process, if you want proof before committing
- Your terminal as it runs or as it is drawn, modelled and validated against a recorded day
- The estimate, schedule and written proposal for the full study
Prefer to write? connect@groupvb.com · or WhatsApp us from the chat button
VB Group® · Sustainability A Certainty.
Short form. Written proposal.
Your name, work email and organisation, what is being decided, the peak-hour passengers and the date the number is needed.