How many TEU can your berth handle, and how many cranes, yard blocks and gate lanes does the next terminal need? Proven in a simulation before the quay is committed.
Berth, yard, gate, rail, bulk and CFS models, delivered for terminal operators in India and available worldwide through port design consultants and EPCs. Capacity simulation for the planning decision, not a bridge or crane-operator simulator.
Trusted by the World’s Most Demanding Plants.































































What does a port simulation consultant build?
A port simulation consultant builds a computer model of the berth, the terminal and the landside that moves every vessel, container, truck and rake of the forecast year through the port, call by call, and reports berth occupancy, vessel waiting time, crane and yard utilisation, truck turnaround and the TEU or tonnes the terminal can actually handle. It is a discrete event simulation (a model that advances one event at a time: a vessel arrives, a crane lifts a box, a truck joins the gate queue), built in FlexSim from your vessel schedule, call sizes and measured handling rates. It is capacity simulation for a planning decision, not a bridge, pilotage or crane-operator training simulator.
Three situations bring the work in. A berth or a terminal is being sized for a DPR, a concession bid or a capex paper. An authority, an operator or an acquirer wants the true capacity of an existing terminal as volumes grow. Or a terminal is already losing vessel windows, paying demurrage or queueing trucks onto the approach road, with the lines, the hauliers and the operator each blaming a different cause. One model serves all three and reports the same set of figures: TEU or tonnes a year at a stated service level, berth occupancy and average wait, crane moves per hour and per vessel, yard occupancy and reshuffles, rake and truck dwell, and the output of every option on the table.
Port capacity terms, in plain words
| Term | What it means | What the model does with it |
|---|---|---|
| Berth occupancy ratio | The share of the year a berth has a vessel alongside | Computed from the simulated calls; the planning rule of thumb says 60 to 70 per cent for a multi-berth container terminal before waiting climbs, and the model shows where your terminal's knee actually is |
| Vessel waiting time | Hours at anchorage between arrival and berthing | The figure the shipping line and the demurrage clause care about; reported as an average and as the worst week |
| Call size and vessel mix | Boxes exchanged per call, and the spread of vessel sizes on the schedule | Drives crane allocation and berth time; a terminal sized on average call size fails on the big ships |
| Quay crane productivity | Gross moves per crane per hour, with the losses for hatch covers, twin-lift and crane interference | Measured at your quay or taken from the TOS logs, never from the crane catalogue |
| Yard occupancy and dwell | Ground slots in use against slots available, and the days a box sits in the yard | Dwell time is the single input that most changes yard capacity; the model tests the dwell rule before the land purchase |
| Truck turnaround time | Minutes from in-gate to out-gate for an external truck | Built from gate lanes, OCR rate, yard pick time and slot booking; the KPI the hauliers measure the terminal by |
| Scenario | One set of changes (a berth, a crane, an RTG, a dwell rule, a gate lane, a schedule case), run as the full forecast year | Each option in the report is one scenario with its capacity, service level and cost |
| Validation | Running the model on a year the terminal already recorded and comparing it with the TOS and berth logs | Done before any option is run; the fit is in the report |
Want the real capacity of your berth, not the formula? The one-page berth check comes back from the vessel schedule and last quarter's berth log.
How many TEU can a berth handle, and how many quay cranes does a new berth need?
As many as the vessel schedule, the call sizes and the measured crane productivity say at the waiting time the shipping lines will accept; the static formula (berth metres times a TEU-per-metre norm, or crane moves per hour times working hours times a utilisation factor) gives the budget figure, and the simulation then finds the capacity the real arrival pattern delivers, which is lower at the big-ship weeks and higher at the mid-week troughs. The same method sizes the yard and its RTGs, the gate lanes, the rail siding and the bulk shiploader.
| Process | What the static formula gives | What the simulation adds |
|---|---|---|
| Berth and quay | Quay length divided by vessel LOA plus clearance, times calls a year; TEU per metre of quay | Berth occupancy and waiting time against the real schedule, vessel bunching, tidal windows, the week that breaks the terminal |
| Quay cranes | Annual moves divided by moves per crane per hour times working hours | Cranes per call by vessel size, crane split and interference, berth time per call, the crane that is idle because the yard cannot keep up |
| Container yard | Annual TEU times dwell days divided by 365, divided by stacking height and slot factor | Block allocation, reshuffles, RTG and reach stacker count by shift, the dwell rule that buys more than new land |
| Truck gate | Peak-hour trucks divided by lane throughput | Lane opening plan, OCR against manual, slot booking, yard pick time, turnaround from gate to gate, queue on the approach road |
| Rail siding | Rakes a day times wagons times boxes per wagon | Line occupancy, RMG or reach stacker transfer rate, rake dwell, missed slots, the third line against a shift rule |
| Bulk and liquid berth | Shiploader or pump rate times working hours | Stockyard or tank farm balance against rake receipts and vessel arrivals, reclaim and blending rules, vessel waiting and demurrage |
A formula carries the DPR through its first review. Only a simulation shows the vessel that waits 31 hours in the week two large ships bunch and a rake runs late, and that single week is what the shipping line, the lender and the concession authority will hold the terminal to.
Get the berth, crane, yard and gate counts for your own forecast year, judged against the waiting time your lines accept.
Which parts of a port does VB simulate?
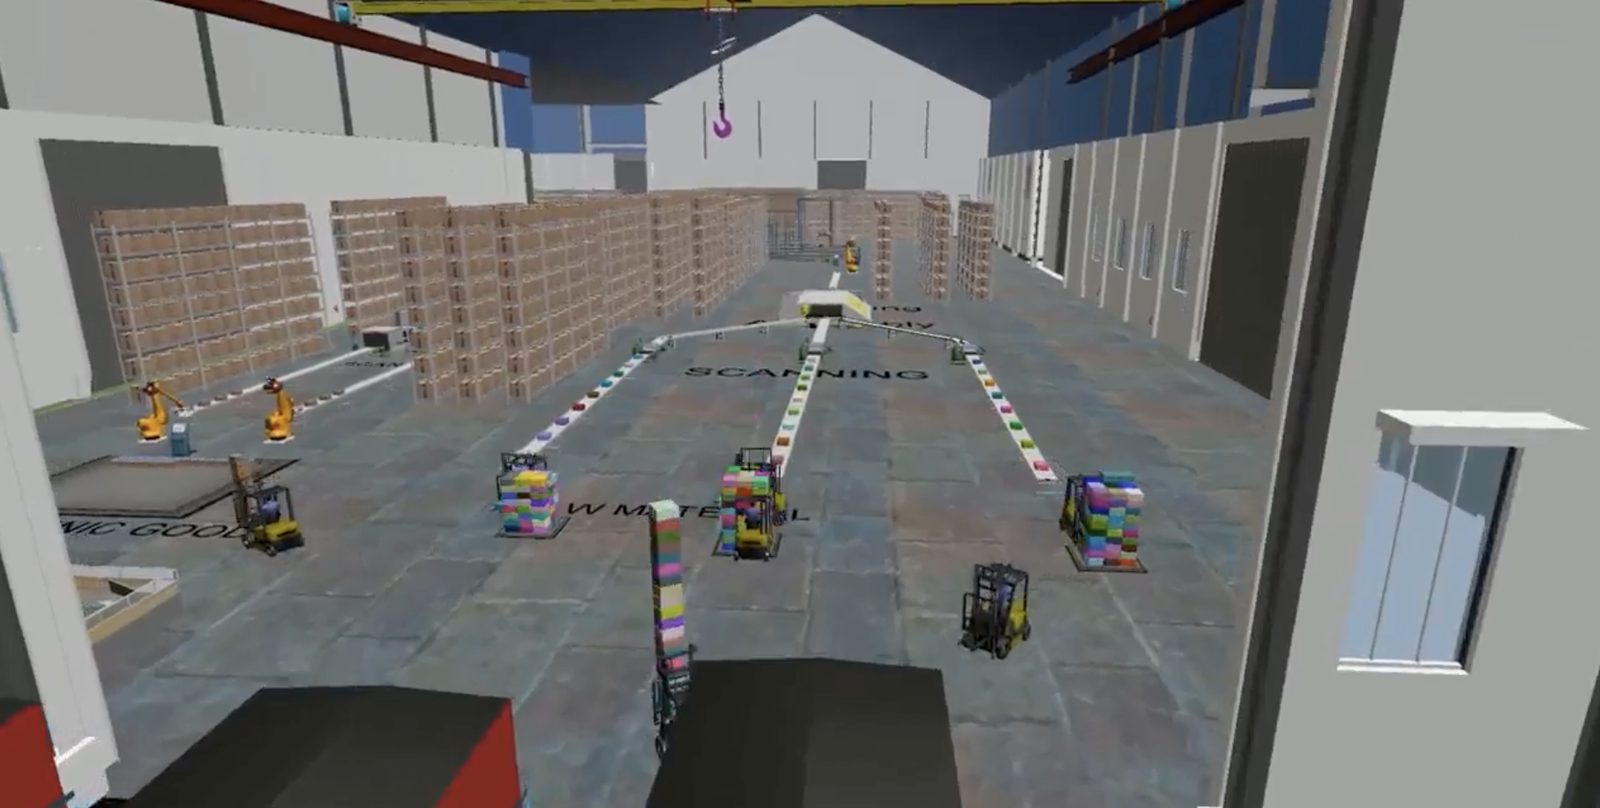
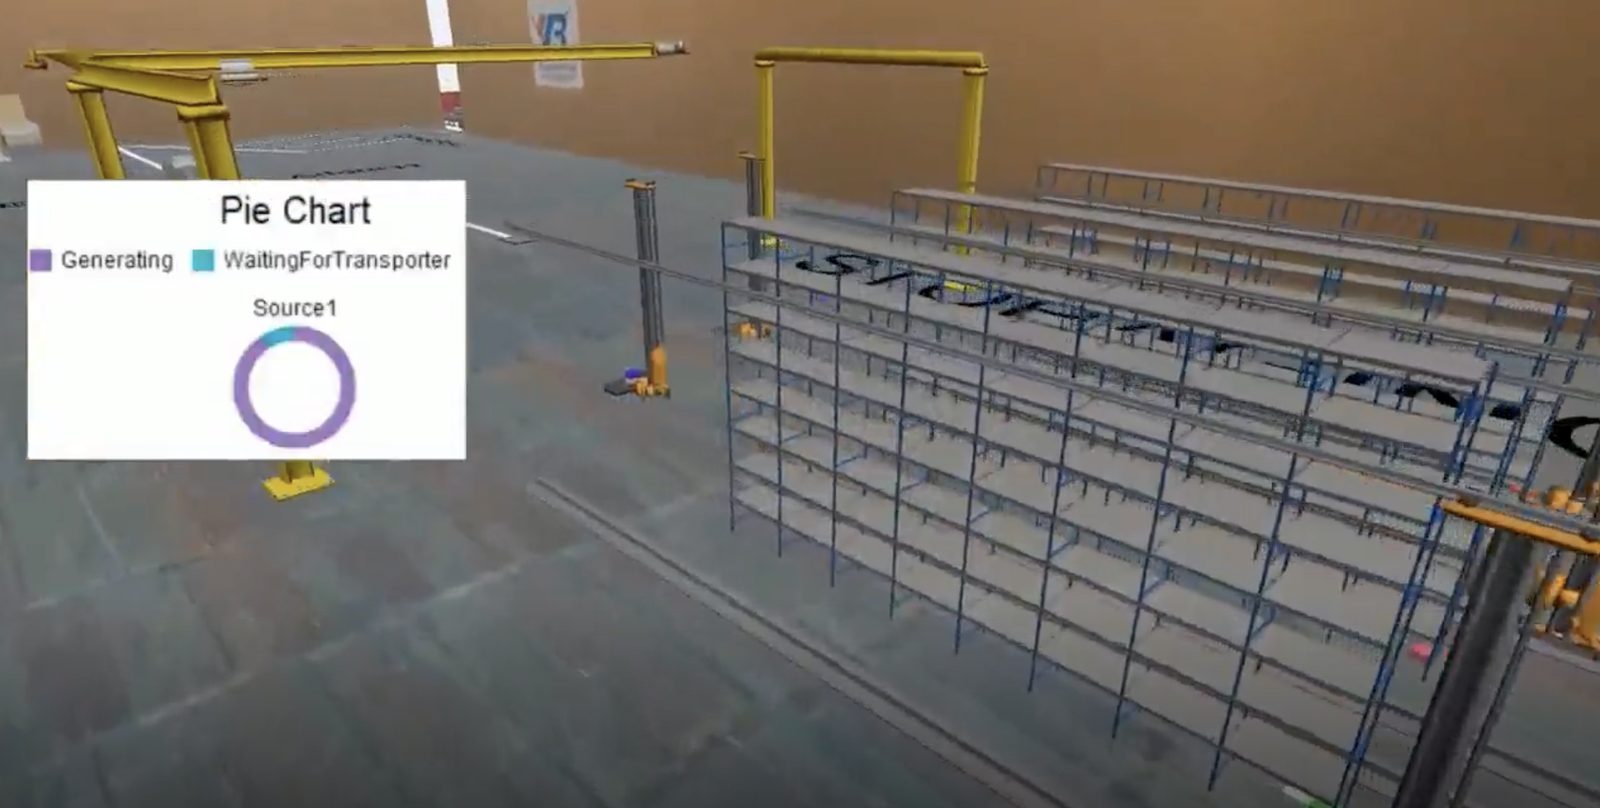
All six process areas of a port and the terminal around them: the berth and quay cranes, the container yard and its equipment, the truck gate and landside, the rail siding, bulk and liquid berths with their stockyards and tank farms, and the warehouse or container freight station. VB models each area as a queue system in its own right and then links them into a single terminal model, so a crane rule at the quay is felt in yard occupancy and a late rake is felt at the gate. The panels below are illustrative runs of each area; your terminal's figures come from your vessel schedule.
All five panels come from one kind of model, a discrete event simulation (one that advances every vessel, container, truck and rake through time, event by event), built in FlexSim on the vessel schedule and call sizes, fed with handling rates measured at your terminal, and judged on berth occupancy, waiting time and turnaround rather than on catalogue capacities.
Model one process area or all six in a single terminal model; the choice follows the decision.
What does a cargo handling simulation look like when it runs?
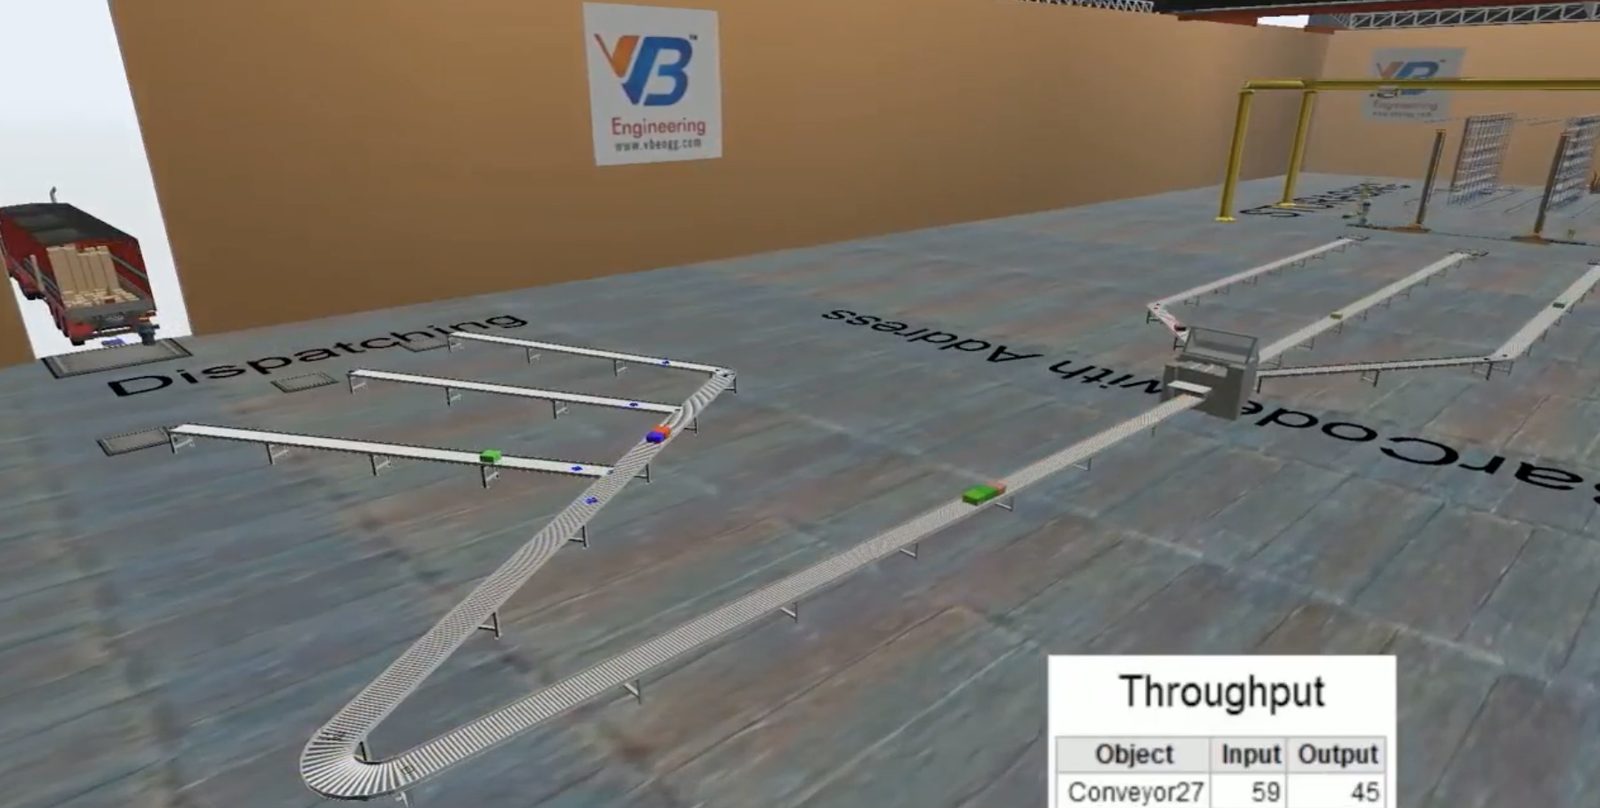
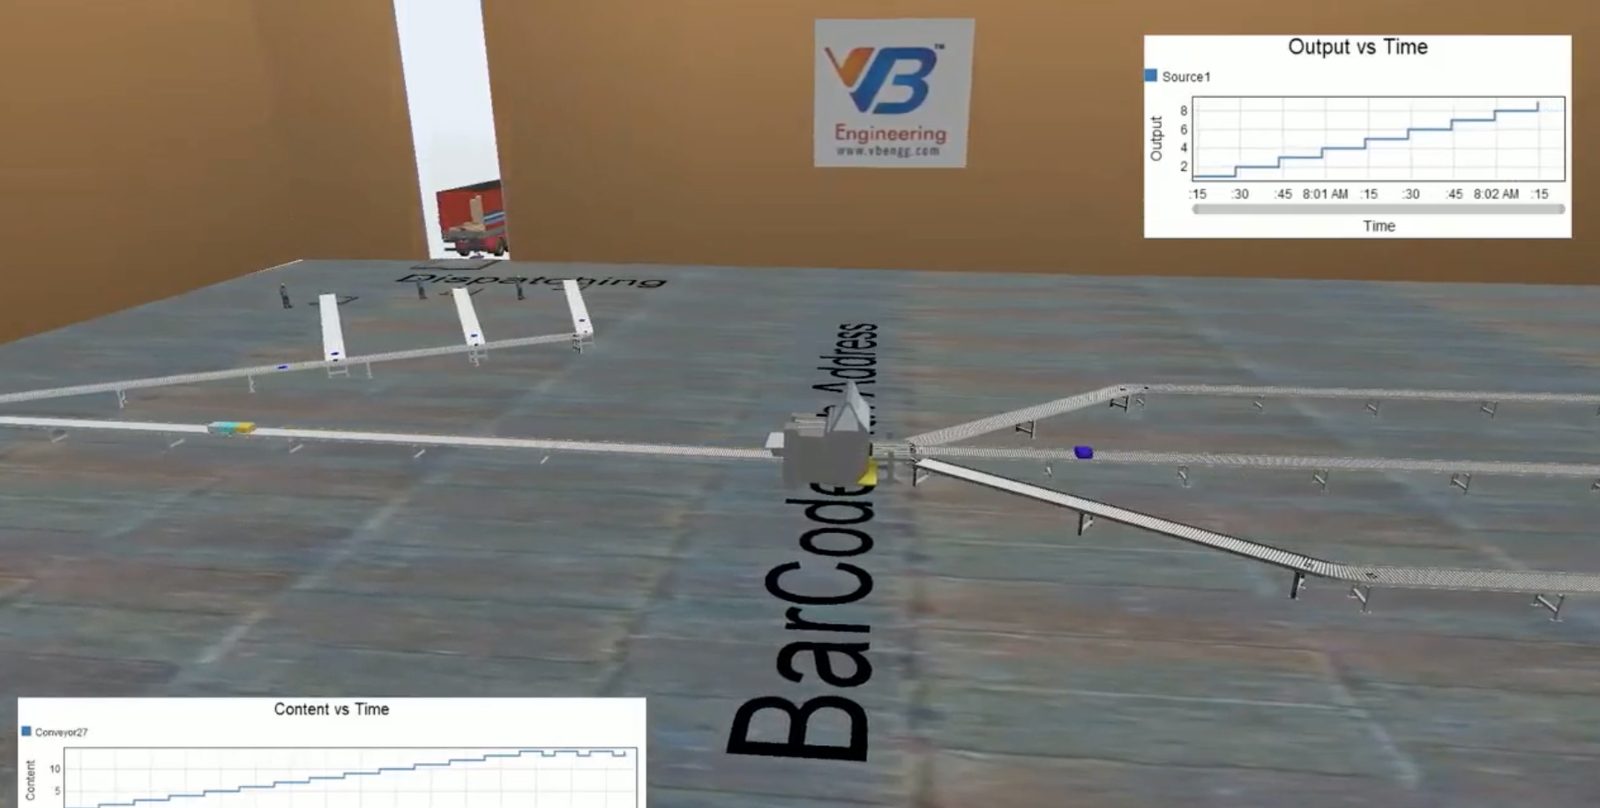
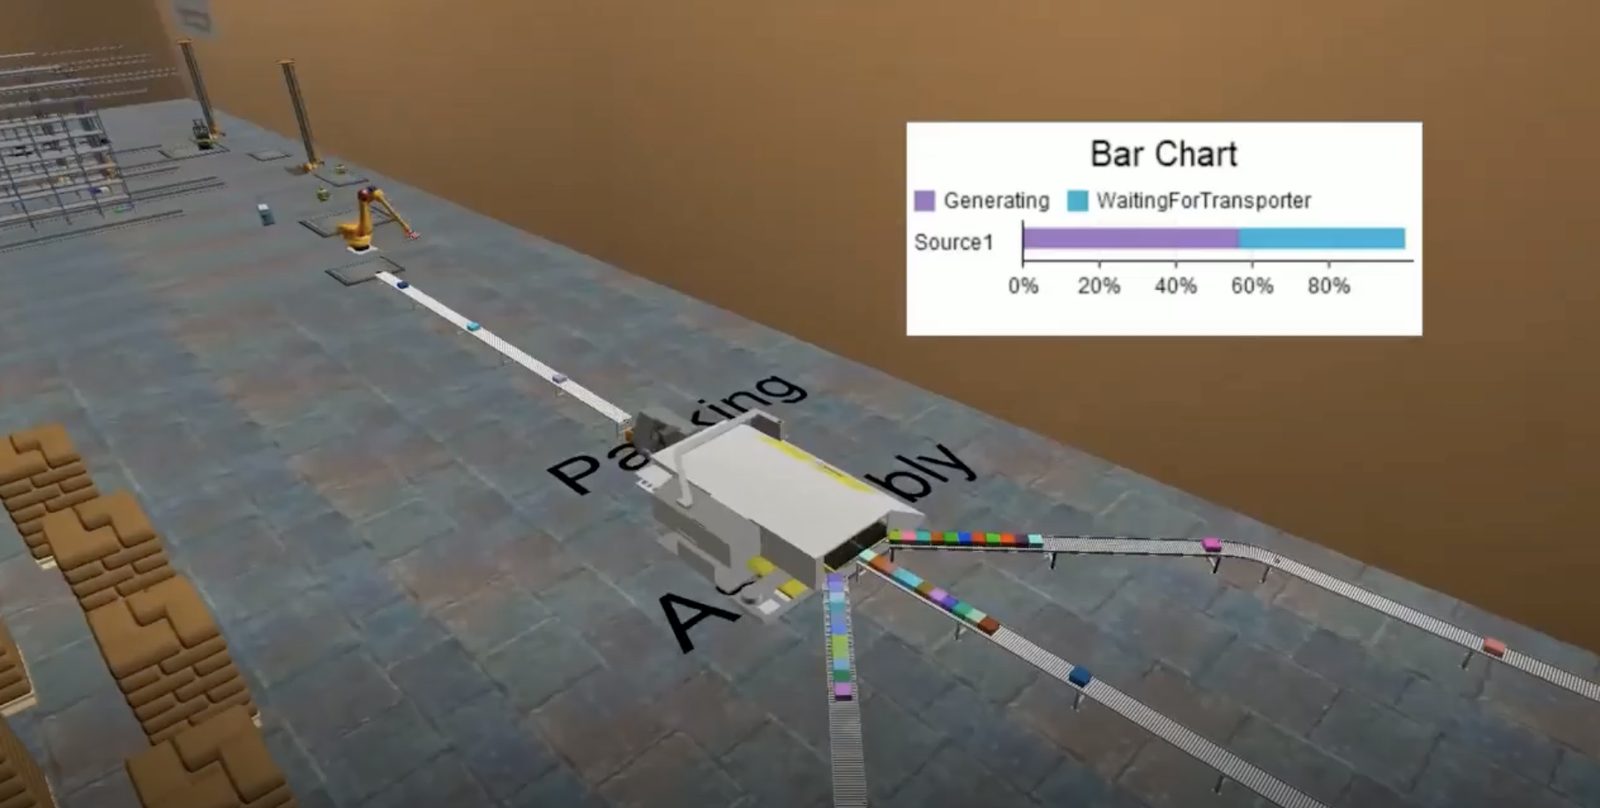
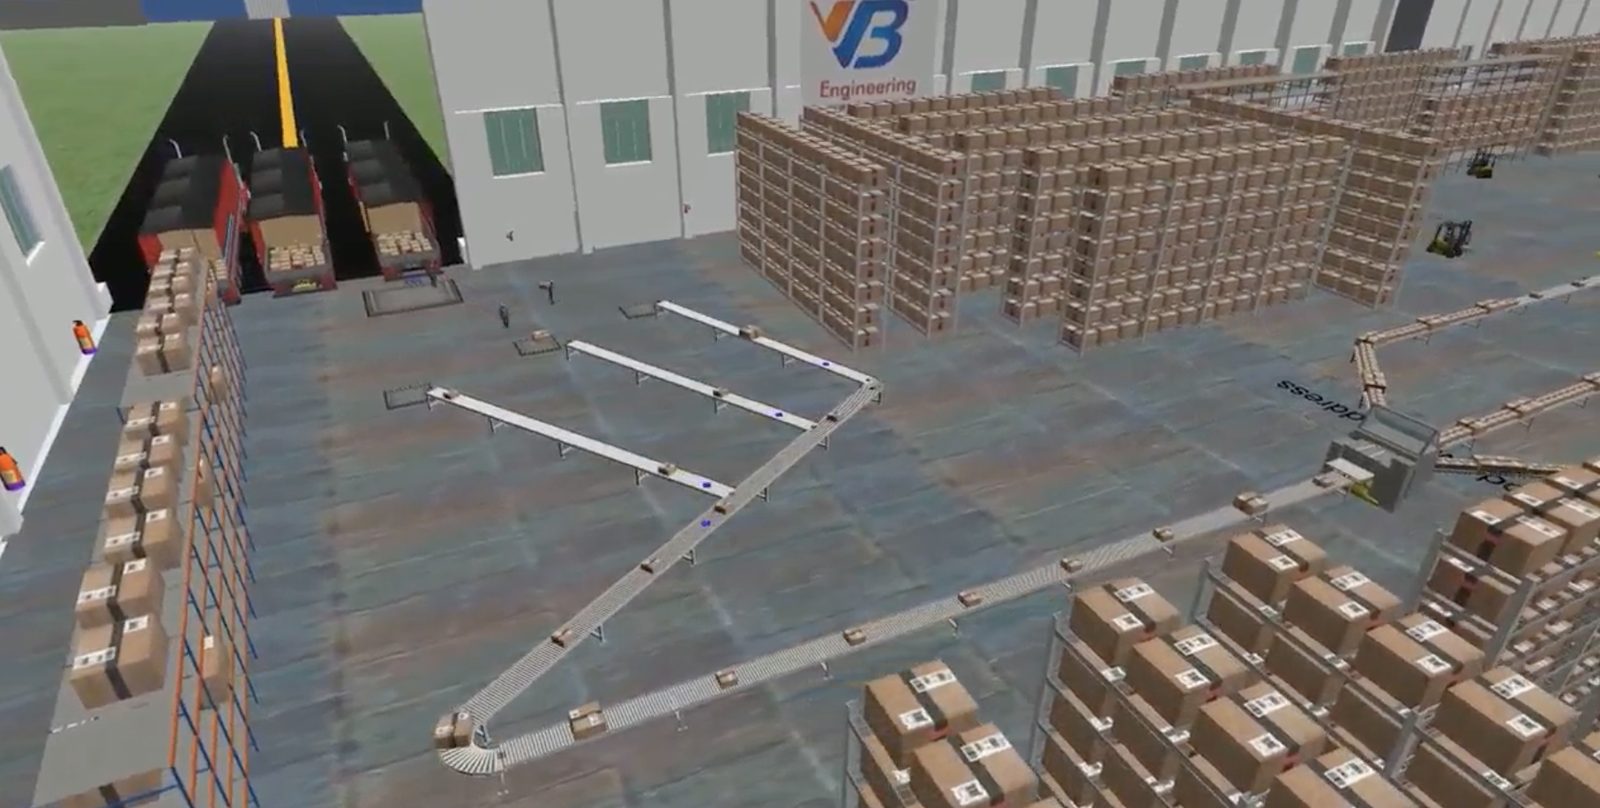
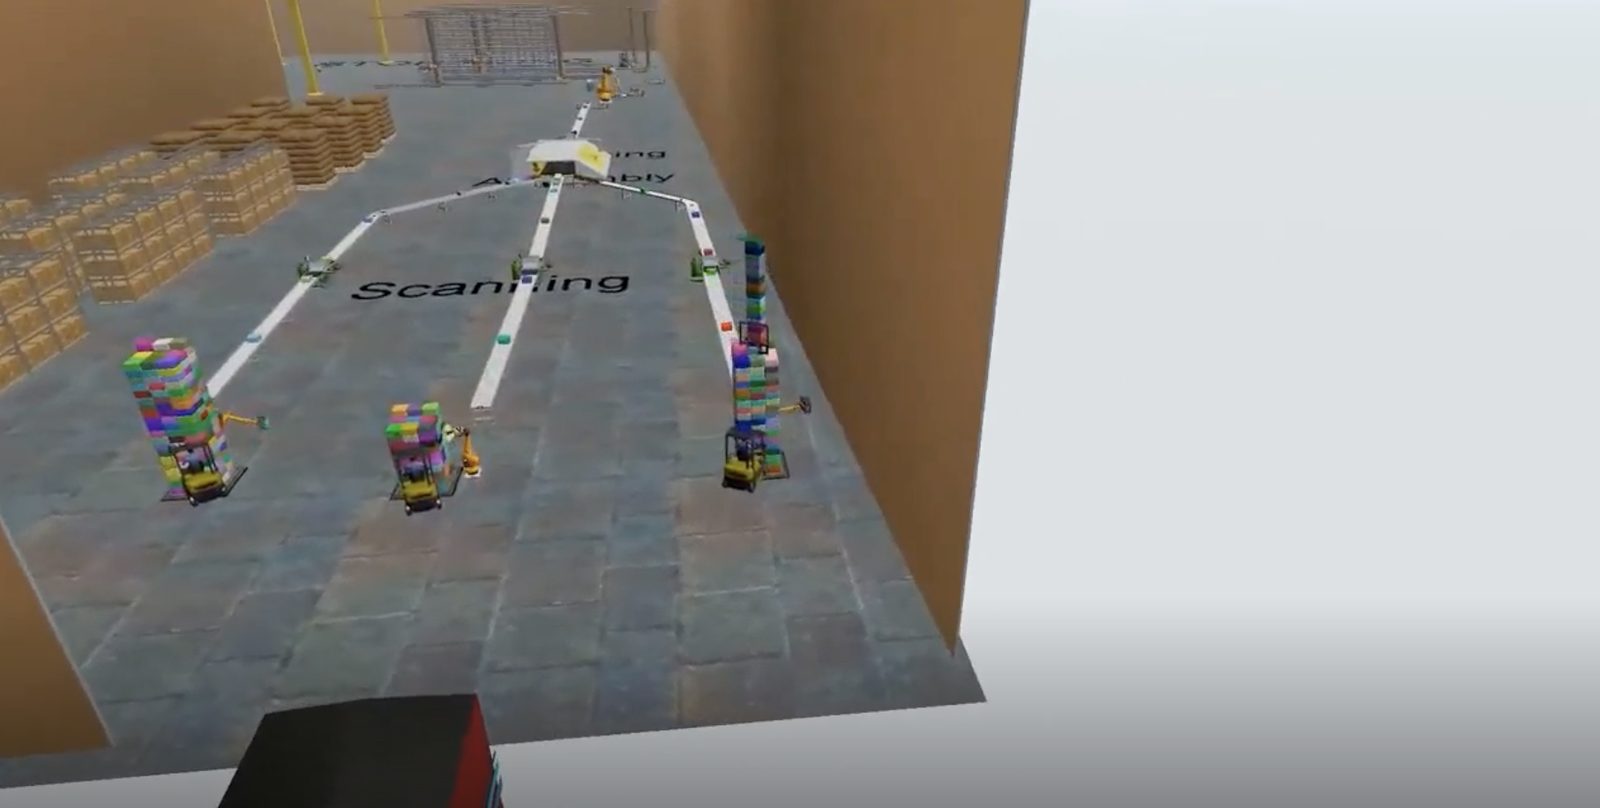
The 3 minute 16 second walkthrough below is VB's own cargo handling model: goods received, scanned, barcoded, packed and dispatched through a container freight station, with the input and output counted per conveyor and the throughput chart building as the run proceeds. It is the warehouse and CFS end of the same model type VB builds for the berth, the yard and the gate, shown as a representative run.
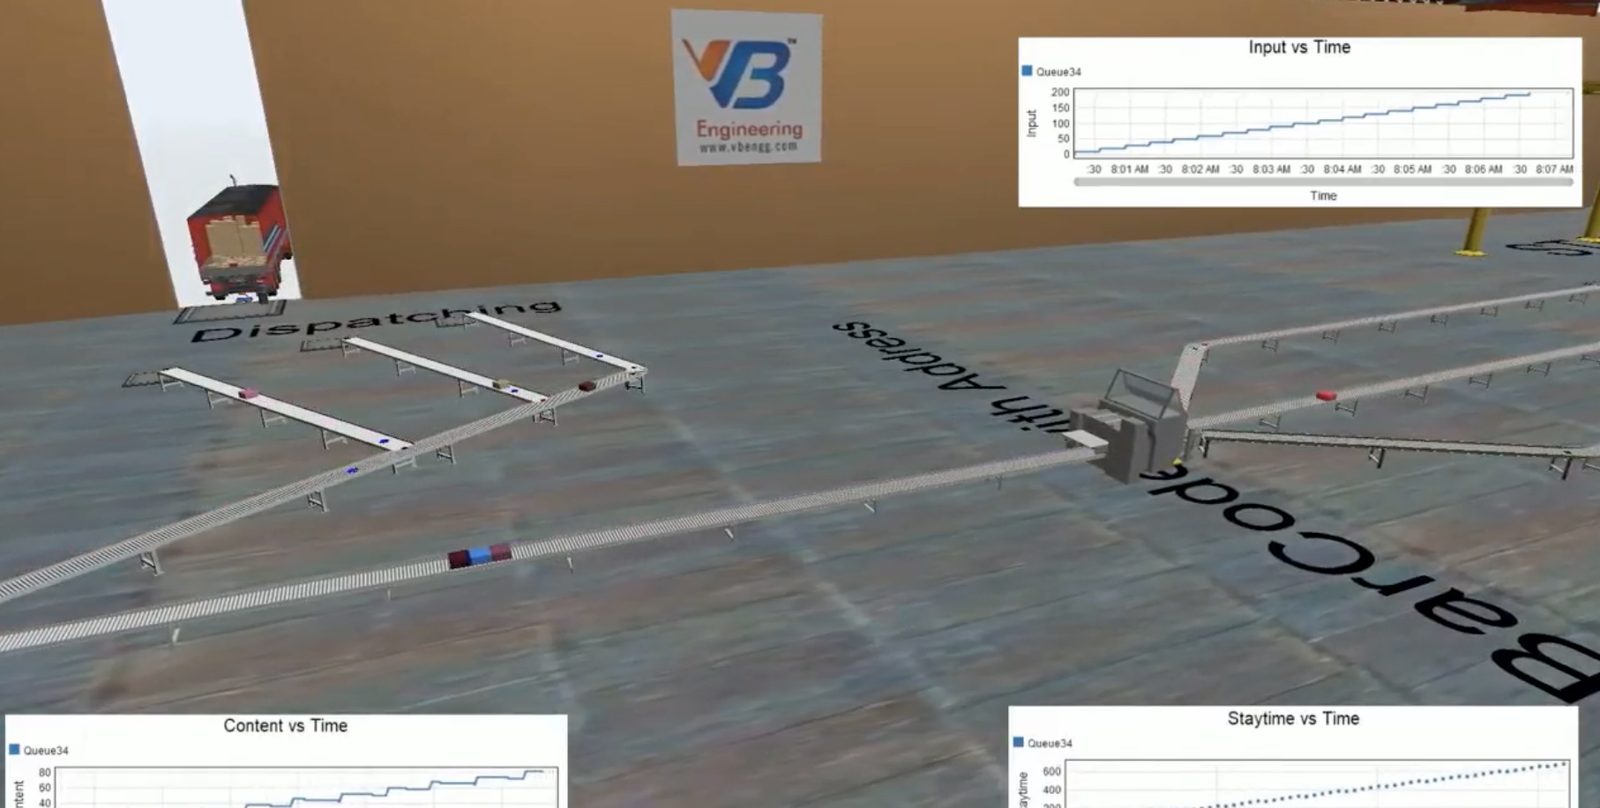
3D simulation of a cargo handling system, VB Group, on YouTube. The player loads only when you press play; no cookies are set before that.
Want this run on your own terminal, with your vessel schedule and your cranes? The one-page berth check comes first.
When does a port or terminal need a simulation study?
A terminal buys the study at the moment a number has to stand up to someone else: the berth and crane counts in a DPR or a concession bid, the capacity figure an authority or an acquirer is about to rely on, or the fix for a terminal that is already paying demurrage and queueing trucks, where the operator, the lines and the hauliers each want a different answer.
New berth, terminal evaluation, demurrage or truck queues: price the study for your situation.
How does a port simulation compare the options for a terminal?
Each option runs through the whole forecast year on one vessel schedule and one set of call sizes, so the options compare on five like-for-like figures: TEU or tonnes handled, berth occupancy, vessel waiting in the average week and the worst week, the quay and equipment required, and cost. Below is a three-berth container terminal facing a new-berth decision, modelled as an illustration; your terminal's table is built from your own schedule.
| Scenario | Berth occupancy | Average vessel wait | Capacity at that service | What it costs |
|---|---|---|---|---|
| Today · 3 berths, 9 cranes, 3 RTGs per block pair | 82% | 19 h | 1.15 million TEU | Nothing; the lines keep the waiting-time breach on record and the demurrage keeps coming |
| Option A · crane allocation rule, dwell rule, one RTG | 74% | 11 h | 1.30 million TEU | A rule change and one RTG; no civil works |
| Option B · Option A plus a fourth berth and two cranes | 64% | 4 h | 1.80 million TEU | One berth, two cranes, yard rule; inside the current footprint |
| Option C · two new berths and a yard extension | 51% | 2 h | 2.40 million TEU | Two berths, four cranes, land; needed only when the forecast passes Option B |
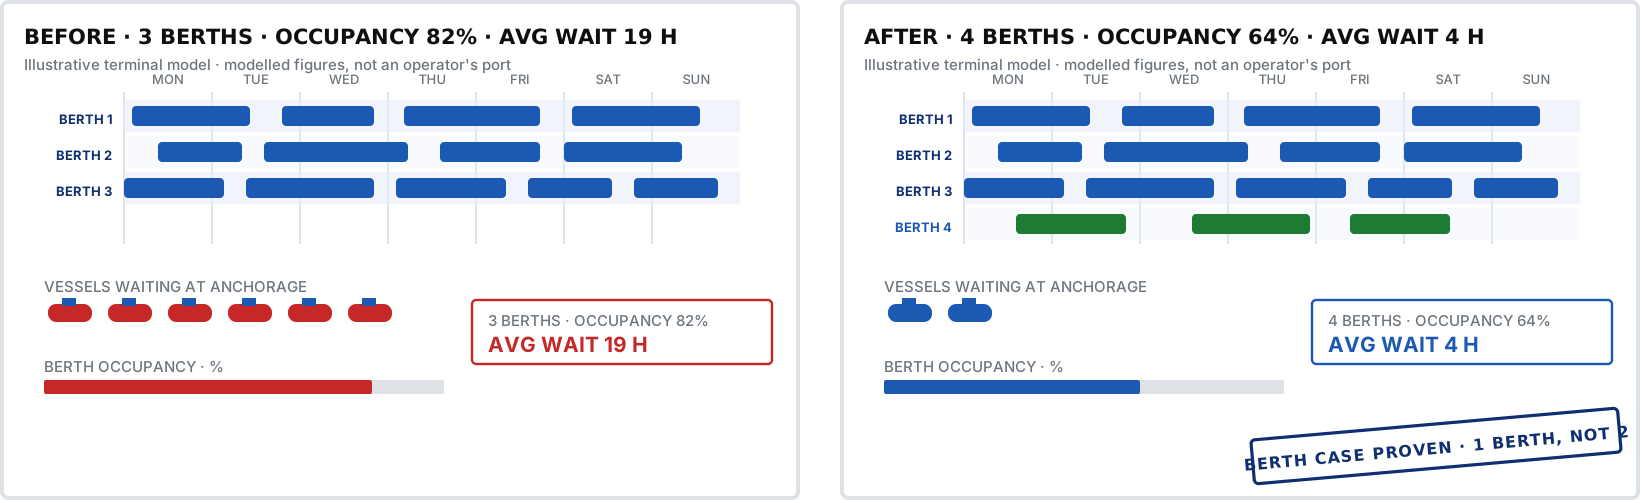
On that one table the board can see the forecast is met by Option B and not by two berths, and the projects head can see that a single berth, two cranes and a yard rule close the gap without new land. The lender, the concession authority and the acquirer each read that table before anything else.
Get the option table for your own terminal: throughput, occupancy, waiting, equipment and cost per option.
Which standards and norms govern a port capacity study?
No statute requires a port simulation, and every norm that governs the terminal shapes what the model is allowed to propose: PIANC and UNCTAD guidance set the berth-occupancy and service-level norms the scenarios are scored against, the concession agreement sets the service levels and capacity triggers, and the port authority and the terminal design codes govern the quay, the dredged depth and the stacking the yard may carry.
| Standard or norm | What it does to the options |
|---|---|
| PIANC working group guidance on container and bulk terminal design | Berth occupancy and vessel waiting norms, quay crane and yard planning parameters, gate design. Every scenario is scored against the occupancy band PIANC gives for the berth count; the report says which band each option lands in and in which weeks it leaves it. |
| UNCTAD port development and terminal planning handbooks | The capacity formulas the DPR uses (TEU per metre of quay, yard slots per TEU, dwell-based yard capacity). The model starts from the same formulas and reports the gap between them and the simulated figure, so the DPR and the model reconcile. |
| Concession agreement, port authority tariff and service-level terms | Minimum guaranteed throughput, berth productivity and waiting-time commitments, capacity-triggered expansion clauses. They are inputs to the model; the option table is written against them. |
| Terminal design codes and the operator's own standards | Quay structural and dredged-depth limits, stacking heights the pavement allows, the group's equipment and TOS standards. A stand-in for a crane or an extra tier only counts if the code and the pavement allow it. |
The occupancy and waiting norms used, and the forecast case the terminal was sized to, are stated on the first page of every VB port report so a lender or a concession authority can see the basis.
What does a port simulation study include?
VB models the terminal as it runs today, or as the drawings show it, checks the model against a recorded year, and finishes with an option table and a report written so that the board, the designer, the lender and the concession authority can each lift their own page from it.
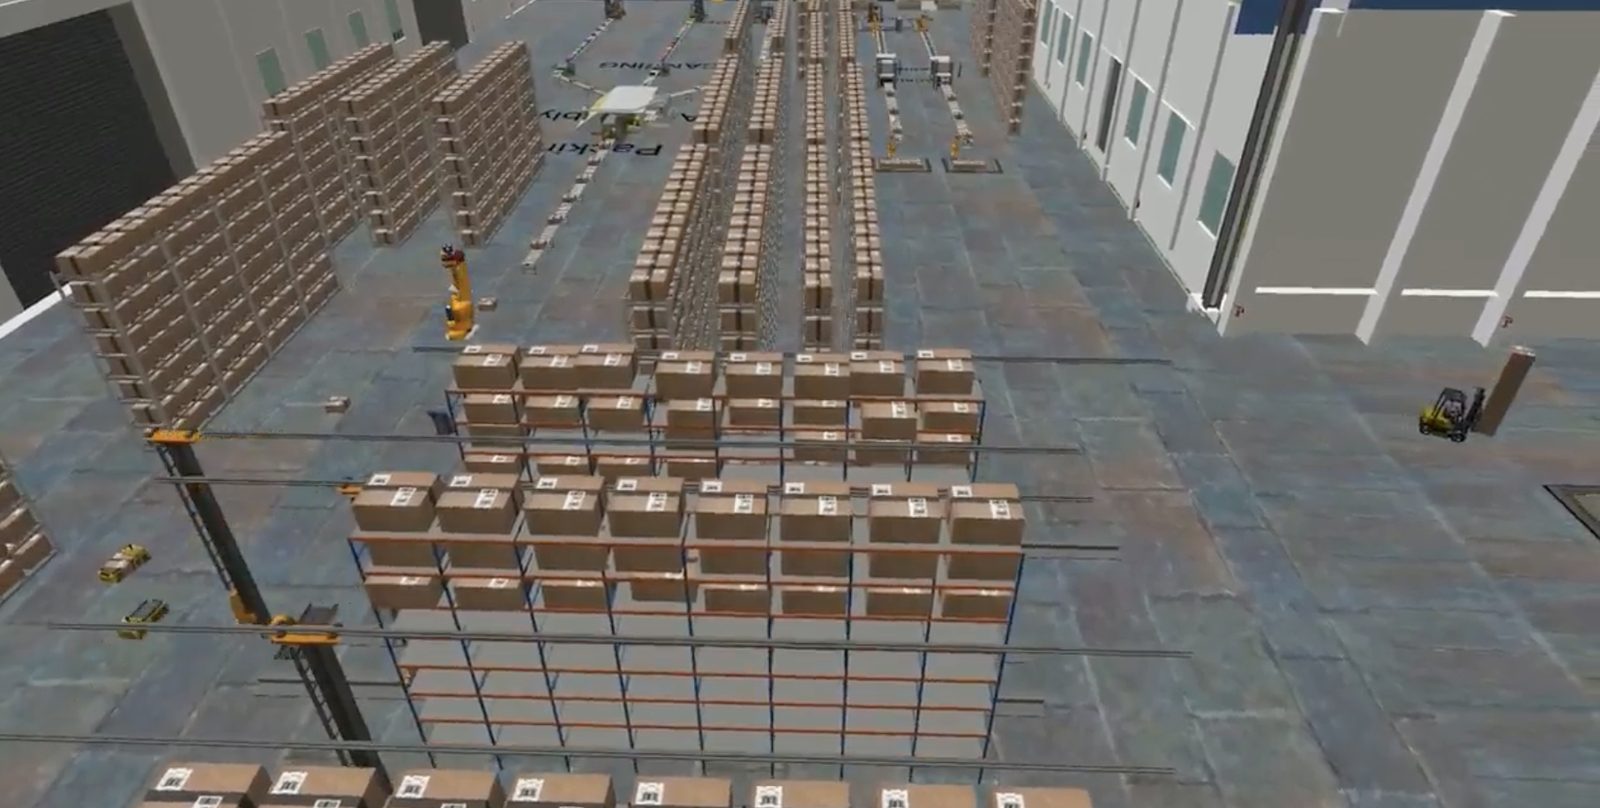
- Data pack: vessel schedule and call sizes for the base and forecast years, handling rates measured at the quay, yard and gate, dwell time distribution, truck arrival pattern, rake schedule, equipment fleet and TOS rules
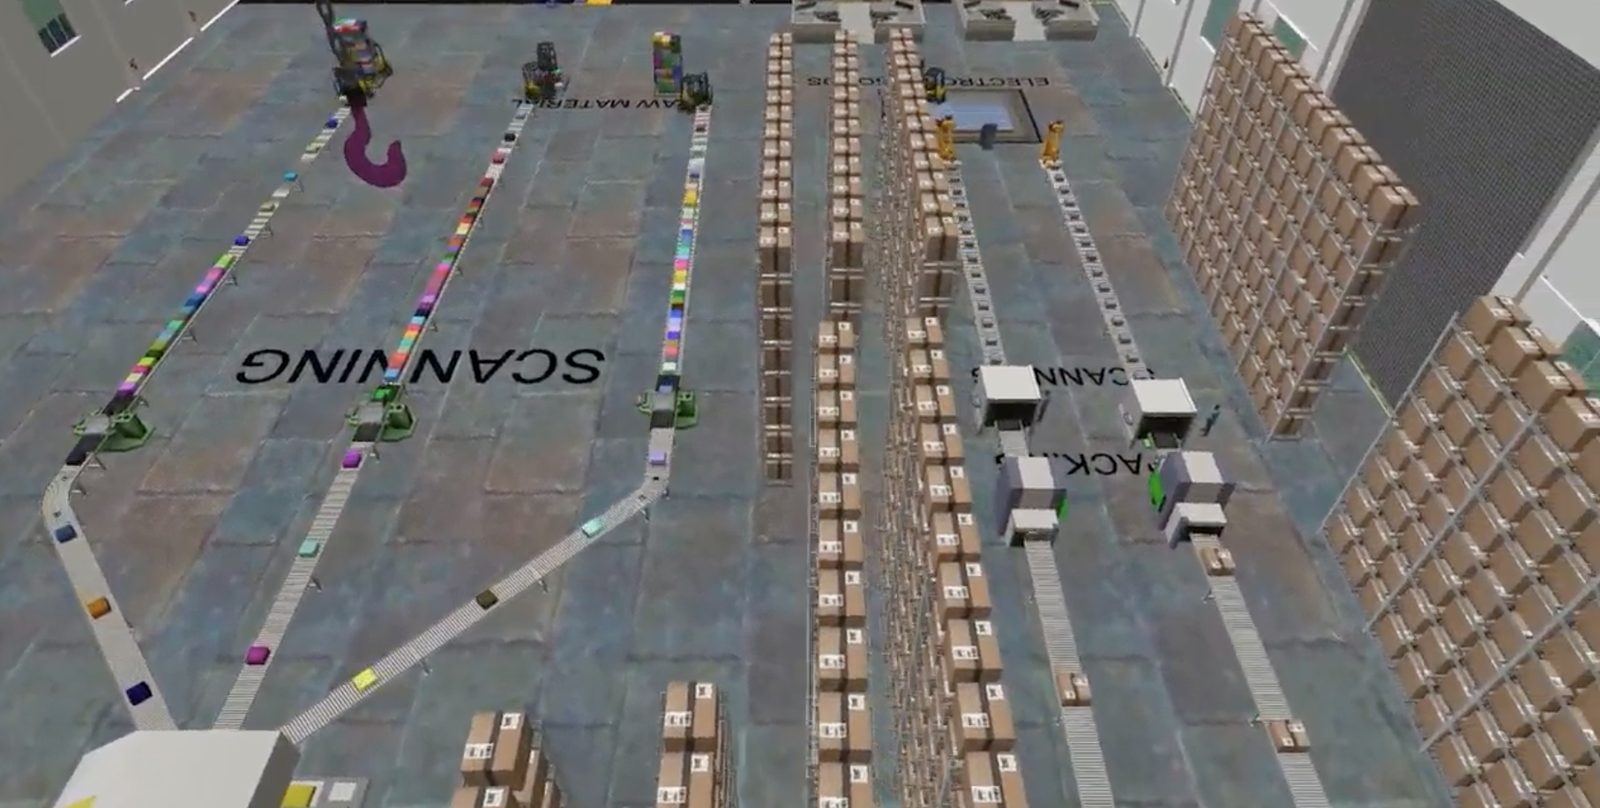
- Whole-terminal model in FlexSim: berth and cranes, yard and equipment, truck gate, rail siding, bulk or liquid berth and stockyard, warehouse or CFS, or any one of them alone
- Validation run against a recorded year, with the fit against the TOS and berth logs reported before any option is run
- Three to five scenarios, each run as the full forecast year: throughput, berth occupancy, vessel waiting, equipment utilisation, yard occupancy, truck turnaround, cost
- Option table and recommendation, with the berth, crane, equipment and gate schedule and the yard or layout drawing that goes with it
- Capacity report for the DPR, the concession bid, the board paper or the data room, plus the model file and a walkthrough with your team
Send the vessel schedule and last quarter's berth log: the one-page berth check comes back with the occupancy the formula says, the occupancy and waiting the schedule actually produces, and the gap.
How is a port simulation study priced?
Price follows three variables: the number of process areas in the model, whether the vessel schedule and handling rates already sit in your TOS and berth logs or have to be measured on the terminal, and the number of scenarios and forecast years the decision calls for. The smallest study is one process area on your own data; the largest is a whole port with container, bulk and rail in a single model, or a concession bid working to a submission date.
| Part of the work | How it is priced | What moves the price |
|---|---|---|
| One process area (berth and cranes, yard, gate, rail, bulk or CFS) | Annual TEU or tonnes and the counts in play | Scenarios, whether the data is measured or supplied, report for a DPR or a board paper |
| Whole terminal, gate to quay | Terminal size plus field days | Process areas to measure, shifts to observe, lines and hauliers to interview, forecast years |
| Whole port, concession bid or acquisition | Terminals, berths, rail and landside in one model | Phases and forecast years, schedule cases, submission or data-room deadline |
Get a price estimate
Three questions about your terminal. A simulation engineer sets them against the port studies VB has delivered and replies with the estimate.
No calculator quotes this work. A simulation engineer reads what you send, and if you would rather see proof first, the one-page berth check of your busiest berth arrives before the estimate does.
How does VB build a port simulation model?
Four stages, and each one hands you something: a data pack built from your TOS, berth logs and schedule with the gaps measured on the terminal; a model checked against a recorded year; each option run through the full forecast year; and a report walked through with operations, the designer and the shipping lines before the board or the authority sees it.
Data pack
Vessel schedule and call sizes, TOS and berth logs, dwell distribution, truck arrival pattern and rake schedule collected; crane, yard and gate rates measured on the terminal across the peak weeks.Model and validate
Berth, yard, gate, rail and bulk built in FlexSim; a recorded year run and the occupancy, waiting and throughput compared with what the logs say. The fit is reported before any option is run.Scenarios
Three to five options run as the full forecast year: crane and dwell rules, equipment, a berth, a gate lane, a rail line, schedule cases. Throughput, occupancy, waiting, equipment, turnaround and cost on one table.Report and walkthrough
Capacity report for the DPR, the bid, the board or the data room; the model file; and a walkthrough with operations, the designer and the lines so every figure has an owner before it is signed.A berth sized by the static formula is sized for an average week that never happens. Capacity fails in a specific week: two large vessels bunch, a rake arrives late and the yard is already at 90 per cent. VB builds that week into the model from your own schedule and measured handling rates, checks the model against a year the terminal has already lived through, and sizes the berth, cranes, yard and gate only after that check passes.
Data pack to walkthrough in seven weeks. Reserve the measurement fortnight now.
Which software does VB use for port simulation?
VB builds berth, yard, gate, rail and bulk models in FlexSim, the discrete event simulation platform now part of Autodesk, and hands the model file over with the report so your planners can re-run scenarios after the study. Yard layouts and berth plans are drawn in AutoCAD on the terminal base plan, and the occupancy and waiting norms follow PIANC guidance and the UNCTAD port planning handbooks. VB's simulation teams also work in AnyLogic and Simio where a design consultant or an operator standard specifies them.
| Stage | Tools we work in | What you receive |
|---|---|---|
| Data pack | Your vessel schedule, TOS and berth logs, gate records · stopwatch and count on the terminal at the quay, yard and gate across the peak weeks | One data pack with every input and its source, signed off by operations and planning |
| Model and validate | FlexSim berth, yard, gate, rail and bulk model · validation run against a recorded year | The model, its validation fit and the assumptions register |
| Scenarios | FlexSim experimenter, three to five options, each run as the full forecast year | Option table: throughput, occupancy, waiting, equipment, turnaround, cost |
| Layout where needed | AutoCAD on the terminal base plan | Yard block plan, berth and crane arrangement or gate layout in DWG and PDF |
| Report and handover | Capacity report, FlexSim model file, scenario dashboards, 3D walkthrough video, walkthrough session | A DPR annex, a board or data-room paper and a model your planners can keep running |
Running a different platform? Tell us which one in the form. We deliver in the software and drawing standard your plant already uses.
Product names are trademarks of their respective owners.
What does a port simulation study deliver, start to finish?
A private container terminal operator in India asked for its berth and yard to be modelled with a new berth on the capex list and the shipping lines pressing on waiting time. The brief: prove whether the next berth was needed now, in two years or not at all, and give operations a crane and yard rule it could run in the meantime.
The model ran the forecast vessel schedule through the terminal as it stood and then with each option, and reported berth occupancy, anchorage waiting and yard occupancy week by week rather than as an annual average. The crane allocation and dwell rules were tested first, the fourth berth second, and the two-berth extension last, each against the same waiting-time target. The operator received the option table with the year each option is needed, the crane and yard rules for the meantime, and the model file. The operator and its terminal are not named; the figures on this page are representative.
Proof before commitment: a one-page berth check of your busiest berth.
Who builds, checks and signs your port model?
Every proposal names three people and attaches their CVs: the simulation engineer who builds and checks the model, the port planning engineer who tests every input against the schedule and the PIANC and UNCTAD norms, and the approver whose signature goes on the report.
Simulation lead
CV shared with the proposalPort planning engineer
CV shared with the proposalVB Engineering approver
CV shared with the proposalPort simulation: the questions operators, designers and acquirers ask
Can the existing terminal take the forecast volume without a new berth?
Often for longer than the formula says, and that is the first run after validation. The model runs the forecast schedule through the terminal as it stands and reports the first process to breach the waiting-time target and the year it happens. A crane allocation rule, a dwell rule or one more RTG frequently buys two or three years; the report shows the year the berth is actually needed and what it must contain.
Should we simulate a new berth before committing the capex?
Yes, when the berth costs more than the study by a wide margin, which is every berth. The model turns the TEU-per-metre figure into berth occupancy and vessel waiting against your real schedule, and shows the week that breaks the terminal rather than the annual average. In the modelled example on this page one berth and two cranes replaced a two-berth extension in the capex paper.
How many TEU can a berth handle in a year?
The formula gives quay metres times a TEU-per-metre norm, typically a four-figure number per metre for a modern container berth; the simulation gives the throughput your schedule, call sizes and crane productivity deliver at the waiting time the lines accept, which is lower in the big-ship weeks. In the illustration on this page three berths handle 1.15 million TEU at 82 per cent occupancy and 19 hours average wait; your figure comes from your schedule.
How many quay cranes does a new berth need?
Enough to work the largest call on the schedule inside its berth window, allowing for crane split limits and interference, not the annual-moves average. The model allocates cranes per call by vessel size and reports berth time per call and crane utilisation; in the modelled example five cranes brought a 6,000 TEU call from 36 to 22 hours and the sixth added nothing.
How much yard area and how many RTGs does a terminal need for its throughput?
Yard slots equal annual TEU times dwell days divided by 365, divided by stacking height and a peaking factor; the simulation then tests the dwell rule and the block allocation, which change the answer more than land does. In the modelled example a dwell rule from 5.2 to 3.8 days and one more RTG took yard occupancy from 92 to 71 per cent with no new land.
How do you reduce truck turnaround time at a container terminal gate?
By modelling the gate, the yard pick and the out-gate as one queue system against the real truck arrival pattern, then testing the fixes in order of cost: slot booking and lane opening rules first, OCR on the manual lane second, a new gate complex last. The model reports turnaround from gate to gate and the queue on the approach road per 15 minutes.
What inputs does a port simulation need?
The vessel schedule and call sizes for the base and forecast years, crane, yard and gate handling rates, the dwell time distribution, the truck arrival pattern, the rake schedule, the equipment fleet and the TOS rules. Most of it sits in the TOS and the berth logs; VB measures on the terminal what the logs do not hold.
How long does a port or terminal simulation study take?
Roughly seven weeks for one terminal on your own data: a fortnight for the data pack and measurement, a fortnight for the model and its validation, a fortnight for the scenarios and a week for the report and walkthrough. A single process area is quicker; a whole port or a concession bid runs to the submission date. The proposal fixes the schedule for your terminal.
How much does a container terminal simulation study cost?
Price is set by the process areas modelled, by whether the schedule and handling rates exist or must be measured, and by the scenarios and forecast years required. A single process area on your own data is the least expensive; a whole port with container, bulk and rail in one model is the most. Use the estimator on this page and the figure comes by email with a written proposal; VB does not publish a rate card.
What is the difference between port simulation and TOS emulation?
Port simulation answers a capacity and planning question: how many berths, cranes, yard blocks and gate lanes, at what service level, in which year. TOS emulation connects a live terminal operating system to a virtual terminal to test the software's rules and interfaces before go-live. VB delivers both and keeps them separate in the proposal; this page is about the capacity study, and a port simulation consultant is not a bridge or crane-operator simulator provider.
Something this page has not answered? A simulation engineer replies within one working day.
Where to go next
Get a price estimate for your port simulation study
Tell VB what is being decided, which process areas are in scope, the annual TEU or tonnes, and the date the number is due. A simulation engineer replies with the estimate, the programme and a written proposal.
- The one-page berth check of your busiest berth, for proof before you commit
- Your terminal, as it runs or as it is drawn, modelled and checked against a recorded year
- The estimate, programme and written proposal for the full study
Prefer to write? connect@groupvb.com · or WhatsApp us from the chat button
VB Group® · Sustainability A Certainty.
Five fields. A written proposal back.
Name, work email, organisation, the decision in hand, the annual TEU or tonnes, and the date the number is due.